April 25, 2026
6 Best Subscription Analytics Tools for Growing SaaS Businesses

Written by
Content Marketing Manager


April 25, 2026
You didn't wake up this morning wanting to learn about subscription analytics.
You woke up because something is off. Your MRR slipped and nobody can explain why. Three big customers churned and all your payment processor says is "card declined." You're spending more to acquire customers but can't tell if they're worth it. Or maybe your board meeting is in two weeks and you still pull numbers from a spreadsheet that one person understands.
That's why you're here. Not for a feature comparison. For an answer.
This guide walks you through what's actually going wrong in most subscription businesses, which tool fits which problem, and how to pick one without regretting it six months later.
Most founders don't have a data problem. They have a wrong tool problem.
If you're running Google Analytics or staring at your Stripe dashboard trying to understand your business, you're using tools built for single transactions to run a recurring revenue company. Stripe shows you payments. GA shows you visitors. Neither of them understands that the customer who paid you $99 in January is the same customer who paid $99 in February, upgraded in March, and cancelled in July — and that together, those events tell a story worth $847.
This is why you can grow transactions month over month and still be losing money. You're counting payments when you should be counting customer journeys.
The shift from "how much came in this month" to "which customers are compounding and which are leaking" is the entire game. Every tool in this guide exists because of that shift. They just solve different slices of it.
Pick your top pain first, then pick a tool. Not the other way around.
"I can't see what's really happening in my business." You need a unified view of MRR, churn, LTV, and unit economics in one place — without exporting CSVs.
"Marketing is a black box." You spend money on ads but you don't know which channels produce customers who actually stick around and pay you for years.
"Customers are leaving and I don't know why." You need churn reasons, early warning signs, and ideally a way to save at-risk accounts before they cancel.
"Failed payments are quietly killing my MRR." Cards expire, charges fail, and 5-10% of your revenue walks out the door every month through no fault of the customer.
"I'm fundraising and my metrics have to be bulletproof." Investors will interrogate your numbers. You need data they trust.
"I run a mobile app and nothing fits." App store subscriptions work nothing like web SaaS, and generic tools miss most of it.
Keep that pain in mind as you read. The best tool for one problem is overkill for another.
Every tool in this guide tracks these. The difference is how clearly they show you the answer and what they let you do about it.
MRR, broken into four parts. Total MRR is a vanity number. The useful version splits it into new MRR (are you acquiring?), expansion MRR (are existing customers growing?), contraction MRR (are they downgrading?), and churned MRR (are they leaving?). Healthy businesses use expansion to offset 40-50% of churn. If you can't see these four streams separately, you're flying blind on the only number that matters.
Revenue churn, not just customer churn. If you lose ten small customers and keep one big one, your customer churn looks catastrophic while your revenue is fine. If it's the other way around, you're in real trouble. Tracking both tells you whether you have a satisfaction problem or a cash flow problem — they require very different fixes.
CLV to CAC, with a payback clock. The 3:1 ratio everyone repeats is only half the answer. The other half is: how long until you earn back what you spent to acquire the customer? Under 12 months is healthy. Over 24 months means you're giving customers a loan while you slowly run out of money.
Net Revenue Retention. One number that tells you whether your existing customers, left alone, would grow your revenue. Above 100% means yes. Above 120% means you have a real business. Below 90% means you're filling a leaky bucket and every marketing dollar is being wasted on replacement rather than growth.
Time to first value. How long between signup and the customer actually getting something useful from your product. This predicts churn better than almost anything else. If you can't see it, you can't fix the onboarding that's quietly killing retention.
If a tool doesn't make these five easy to see and act on, walk away.
The subscription analytics market has matured significantly. Clear winners have emerged in different categories. Rather than trying to be everything to everyone, the best tools now focus on specific strengths that solve particular business challenges.
Understanding these strengths helps you choose the right tool for your situation. Instead of paying for features you'll never use.
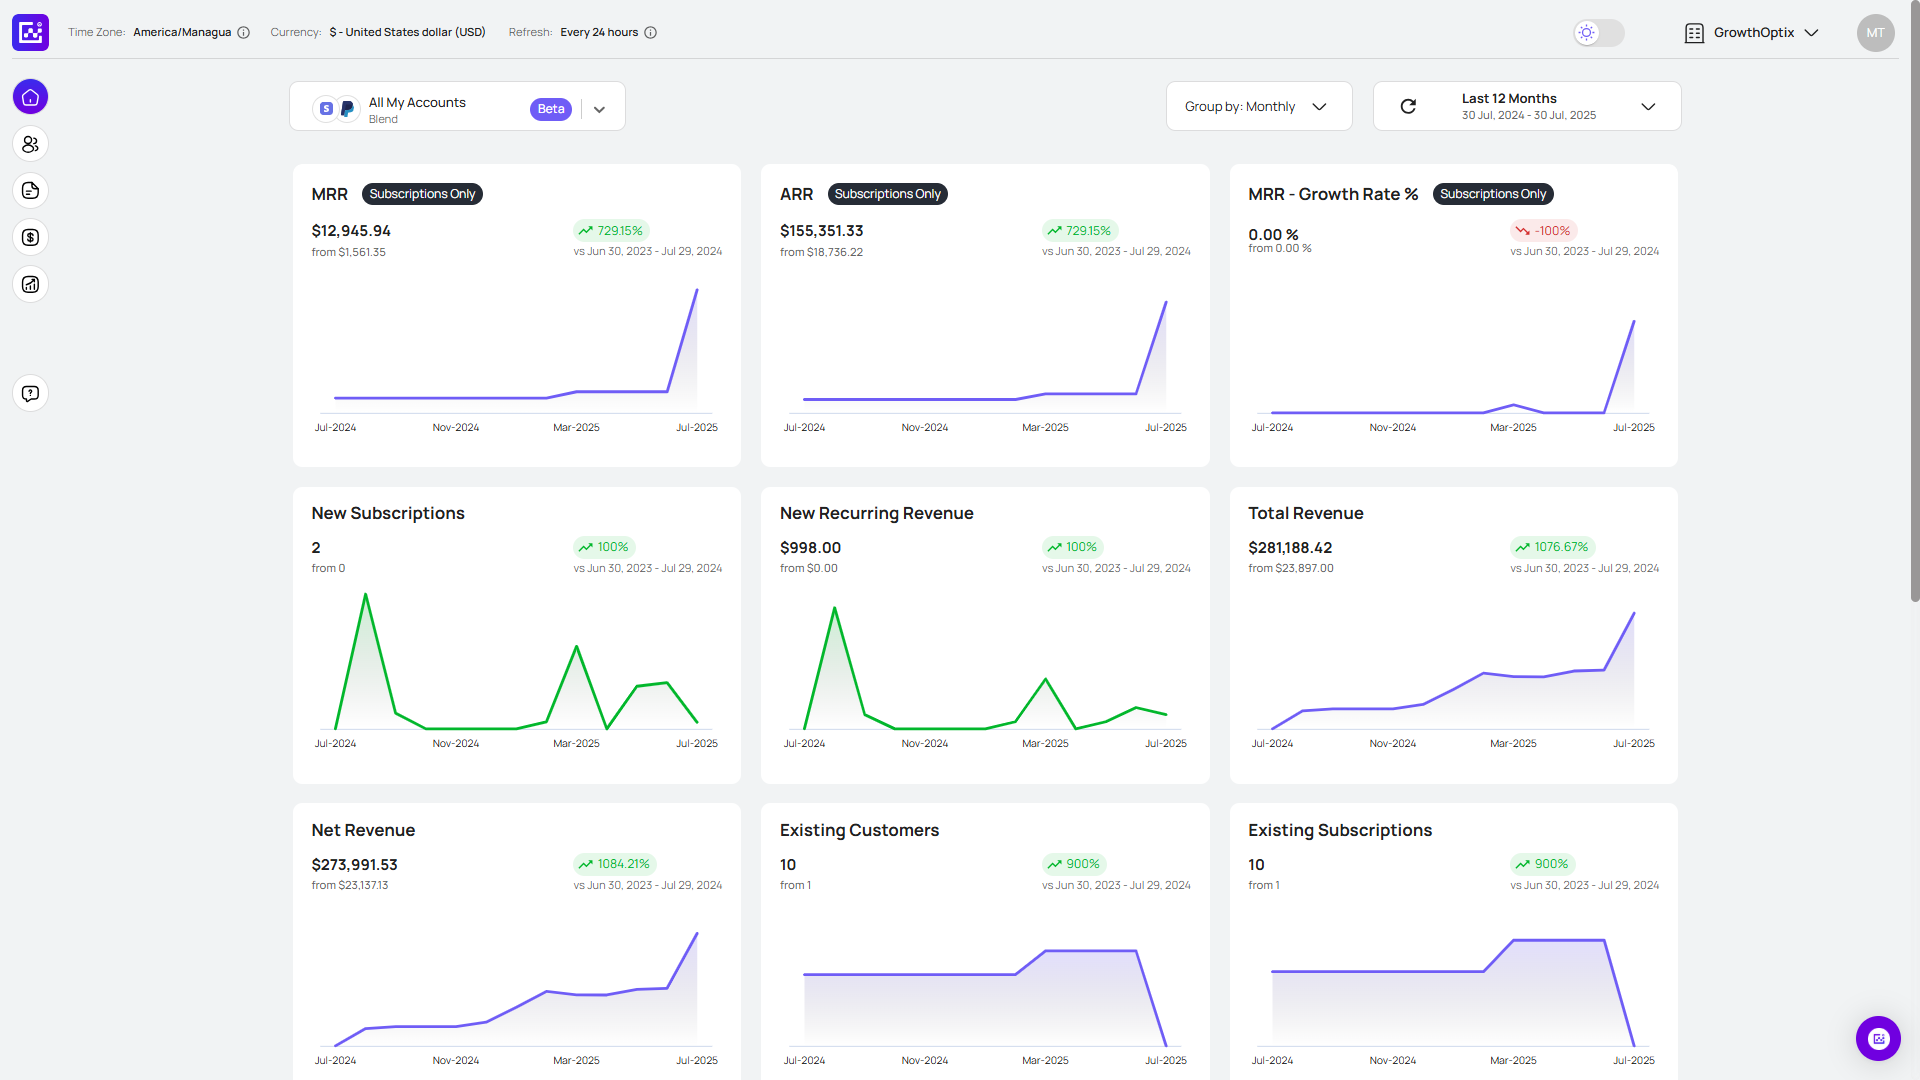
Most analytics tools hand you a dashboard and walk away. GrowthOptix tries to tell you what to do with it.
The pitch is simple: it connects your Stripe, PayPal, ad platforms, CRM, and ecommerce tools, then lets you ask questions in plain English and get back charts, tables, and recommendations. The AI assistant (called FAI) is trained only on your own data, which means you can ask things like "which acquisition channel has the worst 6-month churn?" or "show me everyone who paid over $1,000 and signed up from TikTok" and actually get a useful answer instead of a generic LLM guess.
What makes it genuinely different for most readers of this article:
The Blend. If you run Stripe and PayPal side by side (a surprising number of SaaS and ecommerce businesses do), every other tool forces you to pick one or stitch them together manually. The Blend merges them into one customer database with one set of metrics. This alone saves most teams hours a week.
Marketing attribution that's actually connected to revenue. Most attribution tools tell you which ad got the click. GrowthOptix tells you which ad got the customer who's still paying you 18 months later. It does cross-device, cookieless tracking that still works with GDPR and ad blockers, and ties the whole journey back to MRR, LTV, and expansion revenue — not just first purchases.
Smart Alerts that reach you where you work. Refund spike, churn anomaly, unusual sales drop — you get pinged in Slack, email, or WhatsApp the moment it happens, not when you check the dashboard three days later.
SmartLists for action, not just observation. You can describe a customer segment in plain English and it becomes a live list you can use for retention campaigns, outreach, or analysis.
Best for: SaaS, ecommerce, or AI businesses that want attribution and revenue analytics in one place, especially if you mix Stripe and PayPal or want more than a static dashboard.
What it costs: Starts at $99/month (Starter, under $20K MRR, 80 AI prompts), with unlimited AI prompts starting at the $249/month Growth plan. 14-day free trial, no credit card. Concierge onboarding is included from Growth up.
The real reason to consider it: You want to stop exporting data and start making decisions. If you've been bouncing between Stripe, your ad accounts, a spreadsheet, and ChatGPT to answer basic business questions, this collapses that workflow into one place.
vestors Trust
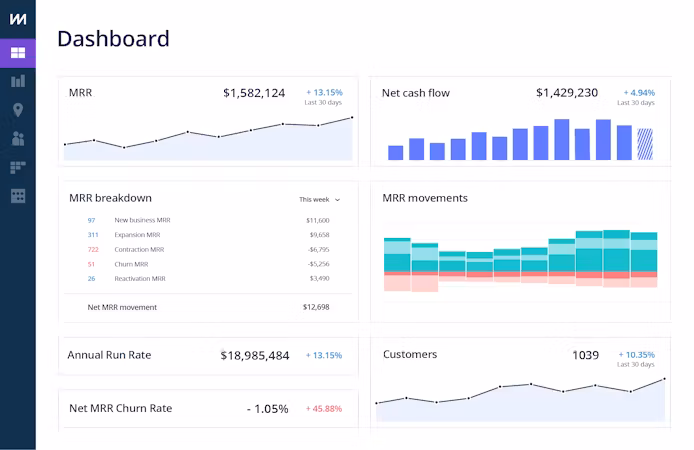
ChartMogul earned its reputation by solving the data accuracy problem that plagues most analytics platforms. When you're making critical business decisions based on metrics, or preparing for investor due diligence, accuracy isn't negotiable. It's survival.
What makes ChartMogul different from the competition
ChartMogul connects to 25+ billing platforms and automatically cleans your data. It uses sophisticated algorithms that handle edge cases other tools miss. It processes refunds, prorations, currency conversions, and billing anomalies that break most analytics setups.
More importantly, it provides benchmarking data from 2,500+ similar companies. So you can see if your 5% monthly churn rate is actually good or terrible for your industry and size.
Their 2025 enhancements include predictive churn modeling with 90%+ accuracy. False churn detection that identifies temporary payment failures versus true cancellations. The mobile app allows you to monitor critical metrics during investor meetings or while traveling. With the same data accuracy you get from the desktop platform.
Best for you if: You run a B2B SaaS company that needs investor-grade reporting accuracy. You want comprehensive benchmarking against similar businesses. You need bulletproof data integrity for board meetings and fundraising.
Pricing: Free up to $10K MRR, then starting around $100/month with pricing scaling based on revenue. Contact ChartMogul for exact pricing tiers as rates vary by specific ARR levels. The free tier includes core MRR tracking, basic segmentation, and essential reports. Enough for most early-stage companies to establish baseline metrics.
What you might experience: If you're like most founders, you'll discover that customers from organic search have 40% higher lifetime value than paid acquisition. This insight alone can completely change your marketing spend allocation and improve your unit economics by 60%.
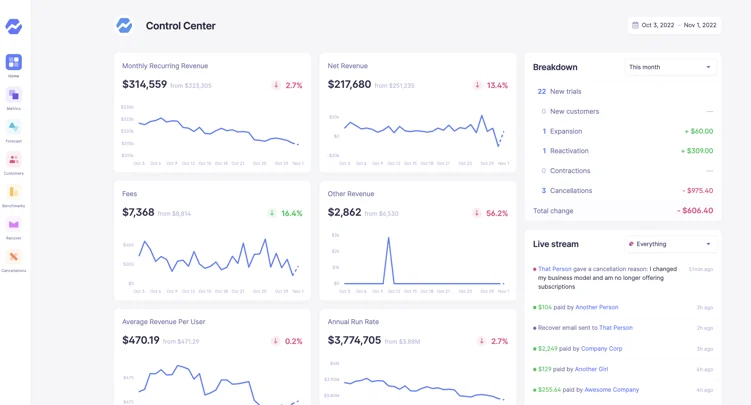
If ChartMogul focuses on data accuracy, Baremetrics excels at actionable insights. These directly impact your bottom line within days of implementation. Their approach combines analytics with automated revenue optimization tools. The results often pay for the entire platform within the first month.
What makes Baremetrics special beyond basic analytics
Recover automatically retries failed payments using smart algorithms. It optimizes retry timing, payment methods, and customer communication. It can recover 10-15% of failed charges. For most businesses, this translates to significant revenue.
If you have a $50K MRR business losing 5% revenue monthly to failed payments, Recover can save you $30K+ annually while improving customer experience through intelligent retry logic.
Beyond payment recovery, Baremetrics provides cancellation insights through automated feedback collection. Real-time financial forecasting with QuickBooks/Xero integration. Advanced customer segmentation based on behavior patterns that predict future actions.
Best for you if: You run a B2C subscription business or any company dealing with significant payment failures. You face credit card churn, or involuntary churn that impacts monthly revenue.
Pricing: Contact-based pricing that scales with MRR levels. Visit Baremetrics website or contact sales for current pricing information. See GrowthOptix vs Baremetrics for comparison
Implementation tip: Set up Baremetrics' dunning campaigns immediately after connecting your billing data. The revenue recovery features often pay for the entire platform within the first month. Through recovered failed payments alone.
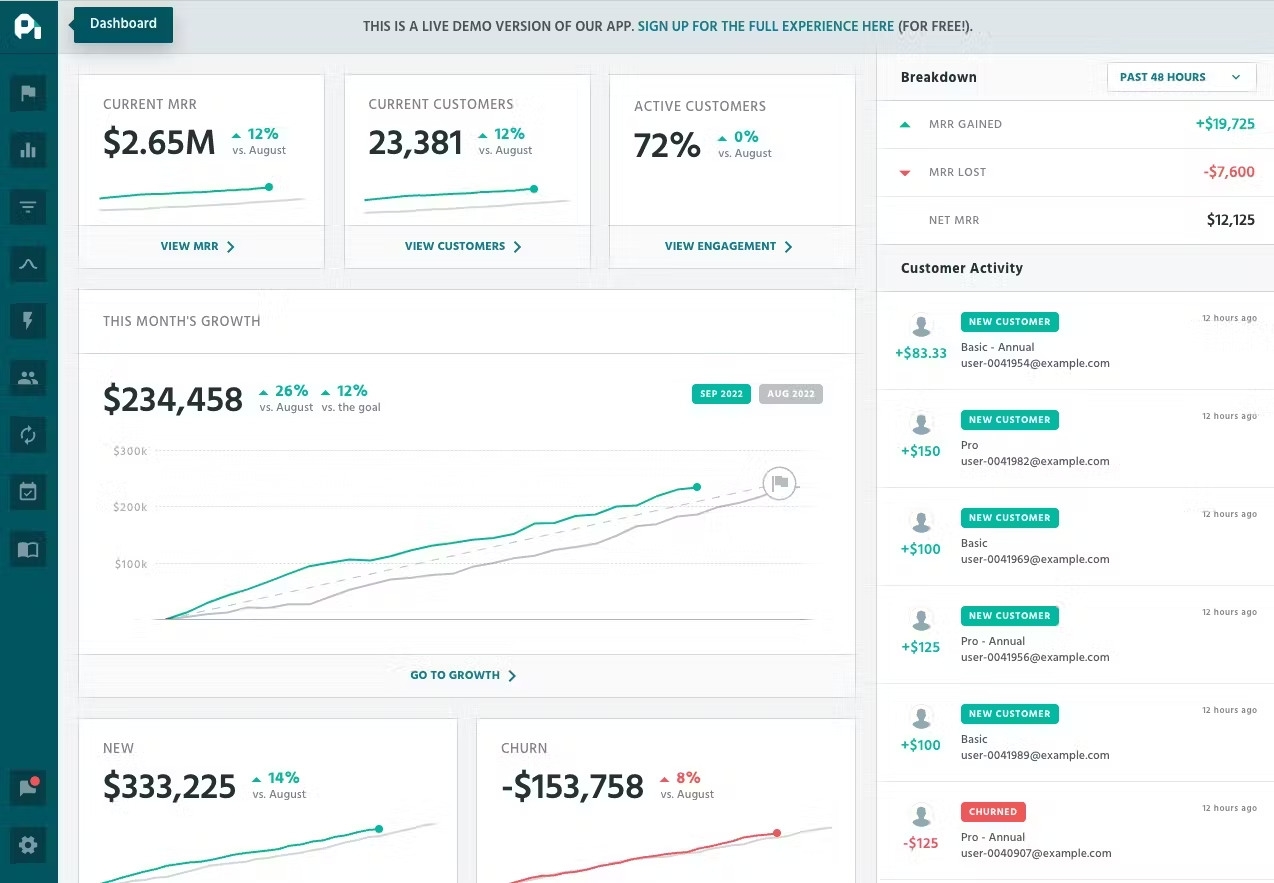
ProfitWell offers something unprecedented in the analytics space. Completely free subscription metrics forever. No revenue limitations or feature restrictions on core functionality.
If you're cash-strapped, this removes the biggest barrier to proper analytics implementation while providing enterprise-grade insights.
What's included in the genuinely free tier
Core MRR tracking with trend analysis. Comprehensive churn analysis with cohort breakdowns. Customer lifetime value calculations with segmentation. Detailed cohort reports showing retention patterns. Benchmarking against similar companies in your industry and size category.
The free tier provides 90% of what you need as an early-stage company. No monthly fees, setup costs, or surprise limitations.
Premium features that justify additional investment
Retain uses machine learning to identify customers likely to churn. It automatically deploys targeted campaigns to keep them. Often reducing churn by 20-30%.
Price Intelligently provides AI-powered pricing optimization based on willingness-to-pay analysis across your customer segments. Revenue Recognition automates financial reporting for investors and acquirers. Compliance with accounting standards.
Best for you if: You're an early-stage startup that needs professional-grade analytics without monthly fees. You want to test subscription analytics thoroughly before committing budget to paid solutions.
Pricing: Free core analytics forever with no limitations. Premium modules (Retain, Price Intelligently, Revenue Recognition) range from $69-$129/month each. You can add features as your business grows and specific needs emerge.
Strategic advantage: Use ProfitWell's free tier to establish baseline metrics and prove ROI from analytics investment. Then add premium modules as your revenue grows and you identify specific optimization opportunities that justify additional spend.
Mobile app subscriptions operate fundamentally differently from web-based SaaS. You face unique challenges around app store policies, platform-specific user behavior, and cross-platform tracking. General analytics tools handle these poorly or miss them entirely.
Mobile-specific advantages that general tools can't match
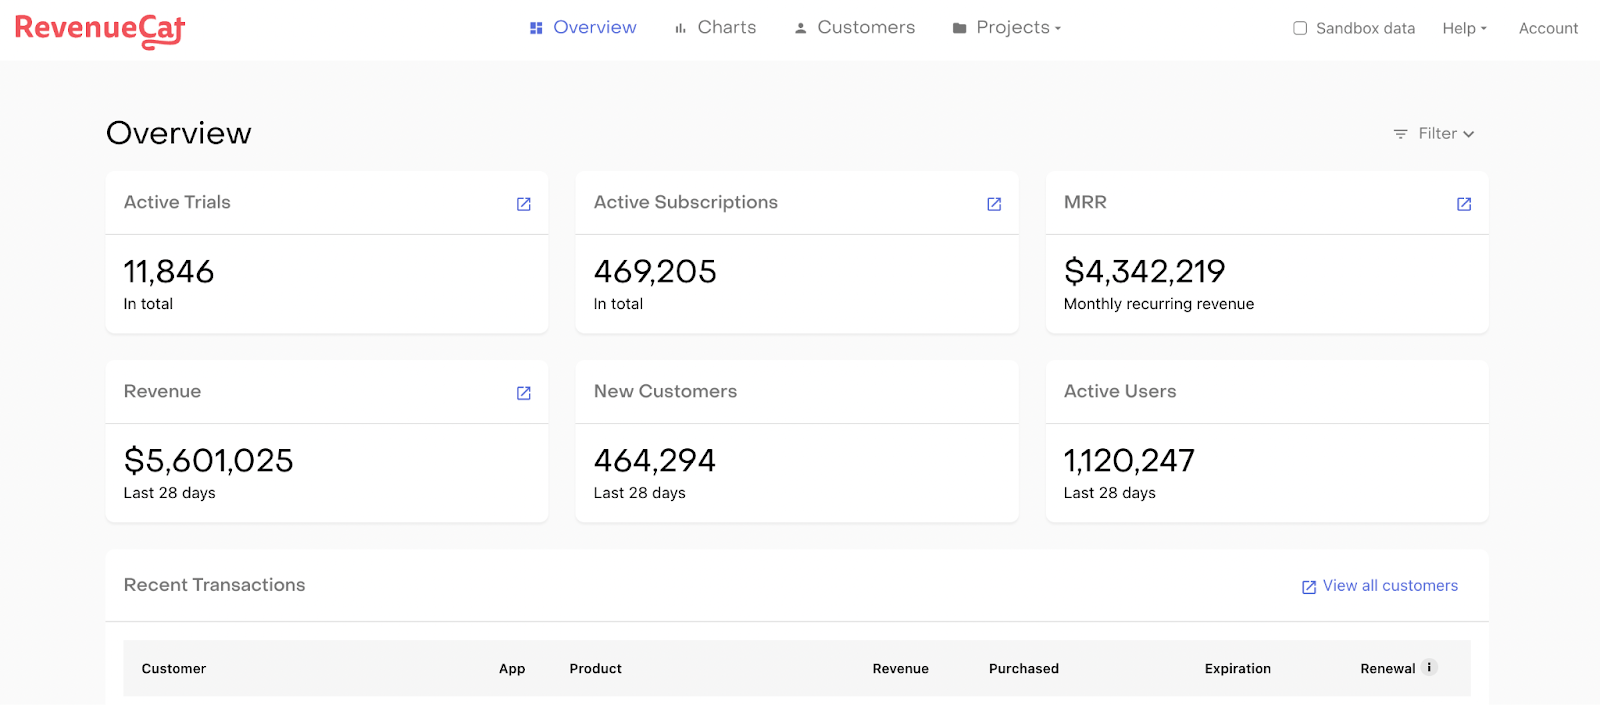
RevenueCat provides 99.5% App Store Connect accuracy with real-time data synchronization. It accounts for app store processing delays and reporting inconsistencies. It unifies subscription data across iOS, Android, and web platforms while handling app store receipt validation, subscription state management, and platform-specific business rules automatically.
Their no-code A/B testing lets you experiment with pricing, trial lengths, promotional offers, and subscription flows without app store review delays or engineering resources.
Advanced cohort analysis accounts for mobile user behavior patterns that differ significantly from web users. Including app usage patterns, notification preferences, and platform switching behaviors.
Best for you if: You have mobile app subscriptions. You run freemium mobile apps requiring sophisticated conversion optimization. You offer cross-platform subscriptions that need unified analytics across web and mobile touchpoints.
Pricing: Free under $2.5K monthly tracked revenue, then usage-based pricing starting around $149/month. Scaling based on monthly tracked revenue volume.
What you'll probably find: Your iOS users typically have 40% higher lifetime value than Android users but 25% higher churn rates in the first 30 days, according to RevenueCat's benchmarking data from thousands of mobile apps.
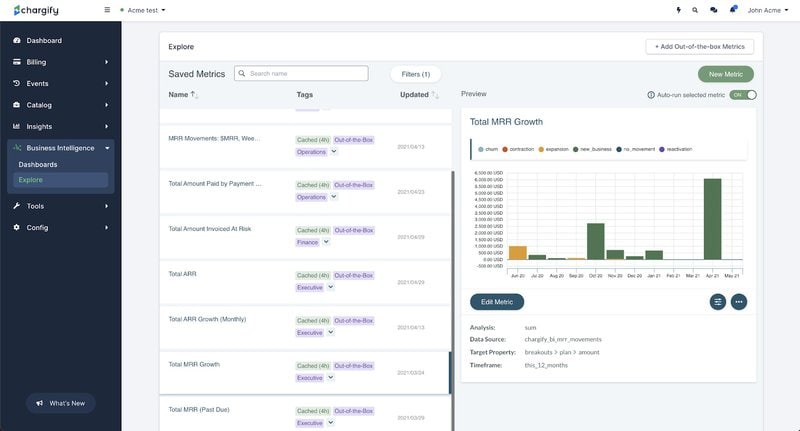
If you have complex billing requirements, enterprise customers, or sophisticated revenue models, you'll quickly outgrow simple subscription analytics. Maxio (formerly SaaSOptics/Chargify) provides enterprise-grade capabilities at growth-stage pricing.
It bridges the gap between startup tools and expensive enterprise solutions.
Complex billing capabilities that simple tools can't handle
Handles usage-based pricing with sophisticated metering. Tiered billing structures with multiple dimensions. Custom contract terms with individual pricing. Multi-product bundling with complex discounting. Enterprise sales cycles with extended trial periods.
Revenue recognition features comply with ASC 606 standards required for audits, investor due diligence, and public company preparation.
Advanced reporting includes cash flow forecasting with scenario modeling. Sales performance tracking with attribution analysis. Customer success metrics with health scoring. Multi-entity consolidation for businesses managing multiple products, subsidiaries, or international operations.
Best for you if: You run a B2B SaaS company with enterprise customers. You have usage-based or complex pricing models. You manage multiple product lines. You're preparing for significant fundraising rounds that require sophisticated financial reporting.
Pricing: $599/month for up to $100K billing volume, with enterprise pricing for larger businesses. Requiring custom integrations, dedicated support, or advanced compliance features.
What you can expect: You'll probably see 60% faster monthly close processes and 40% improvement in forecast accuracy compared to spreadsheet-based financial reporting, while reducing audit preparation time by 70%.
Stop comparing feature lists. Match the tool to your reality:
If you want one tool to cover revenue analytics, marketing attribution, and answers to your ad-hoc questions — especially if you run Stripe plus PayPal, or you're tired of switching between five dashboards — GrowthOptix is the most complete answer for most readers of this article.
If your next board meeting is more important than anything else and you need numbers nobody can challenge, ChartMogul.
If failed payments are visibly costing you money every month, Baremetrics pays for itself.
If you have literally no budget, ProfitWell's free tier is better than most paid tools from five years ago.
If you're a mobile app, RevenueCat isn't really optional.
If your billing is complex enough that your finance lead dreads month-end close, Maxio.
The best analytics tool is the one you actually check. All of these are good. None of them will save a business whose founders open the dashboard once a quarter.
Pick the one that matches your biggest pain, set it up this week, and make a habit of looking at it every Monday morning. The compounding effect of catching a churn trend two weeks early, or spotting that your best channel is actually your third-highest spend, is the entire reason this category exists.
The tool matters less than the habit. But the right tool makes the habit stick.
Join hundreds of SaaS companies who finally understand which marketing drives profitable growth.