March 3, 2026
Billing Metrics Every SaaS Founder Needs to Survive 2026

Written by
Content Marketing Manager

March 3, 2026
Revenue is up. Customer count is growing. Your Stripe dashboard looks healthy every Monday morning. And yet — three enterprise clients just downgraded, two invoices are 30 days overdue, and your head of sales wants a bigger budget while the CFO questions every line item. Something doesn't add up.
That tension is what happens when you measure the wrong things. Most SaaS companies track metrics that reflect the past rather than predict the future. They optimize for numbers that look good in presentations while missing the signals that actually determine whether the business survives the next 18 months.
Q1 2025 data shows churn rates hit their highest point since 2019, even as companies had access to more analytics tools than ever before. Million-dollar ARR businesses watched customers walk out the door while their dashboards were entirely green. The problem wasn't a lack of data. It was tracking the wrong data.
This guide breaks down the four metric categories that genuinely predict SaaS success, how they connect to each other, where most founders go wrong, and the steps to fix it. The goal isn't more metrics — McKinsey's analysis of 200+ SaaS companies found that top performers don't track more metrics than average companies. They track the right ones and understand what each one actually means.
Most founders treat billing metrics as financial plumbing — they track money in, money out, and whatever's left over. That's a significant underuse of the data sitting in your billing system.
These numbers reveal whether your business model works long term. Whether customers genuinely value what you've built. Whether you'll survive an economic downturn. Revenue might appear healthy while customer satisfaction quietly collapses. Growth might look strong while unit economics deteriorate underneath it.
Think of it like a medical checkup. A doctor doesn't just measure your heart rate and call you healthy. Blood pressure, temperature, breathing, reflexes — each measurement reveals something different about your condition. Your billing metrics work the same way. The complete picture only emerges when you connect the data points into a coherent story.
These four categories work together like vital signs. Each reveals something different about your business health, but the real insights come when you understand how they connect.
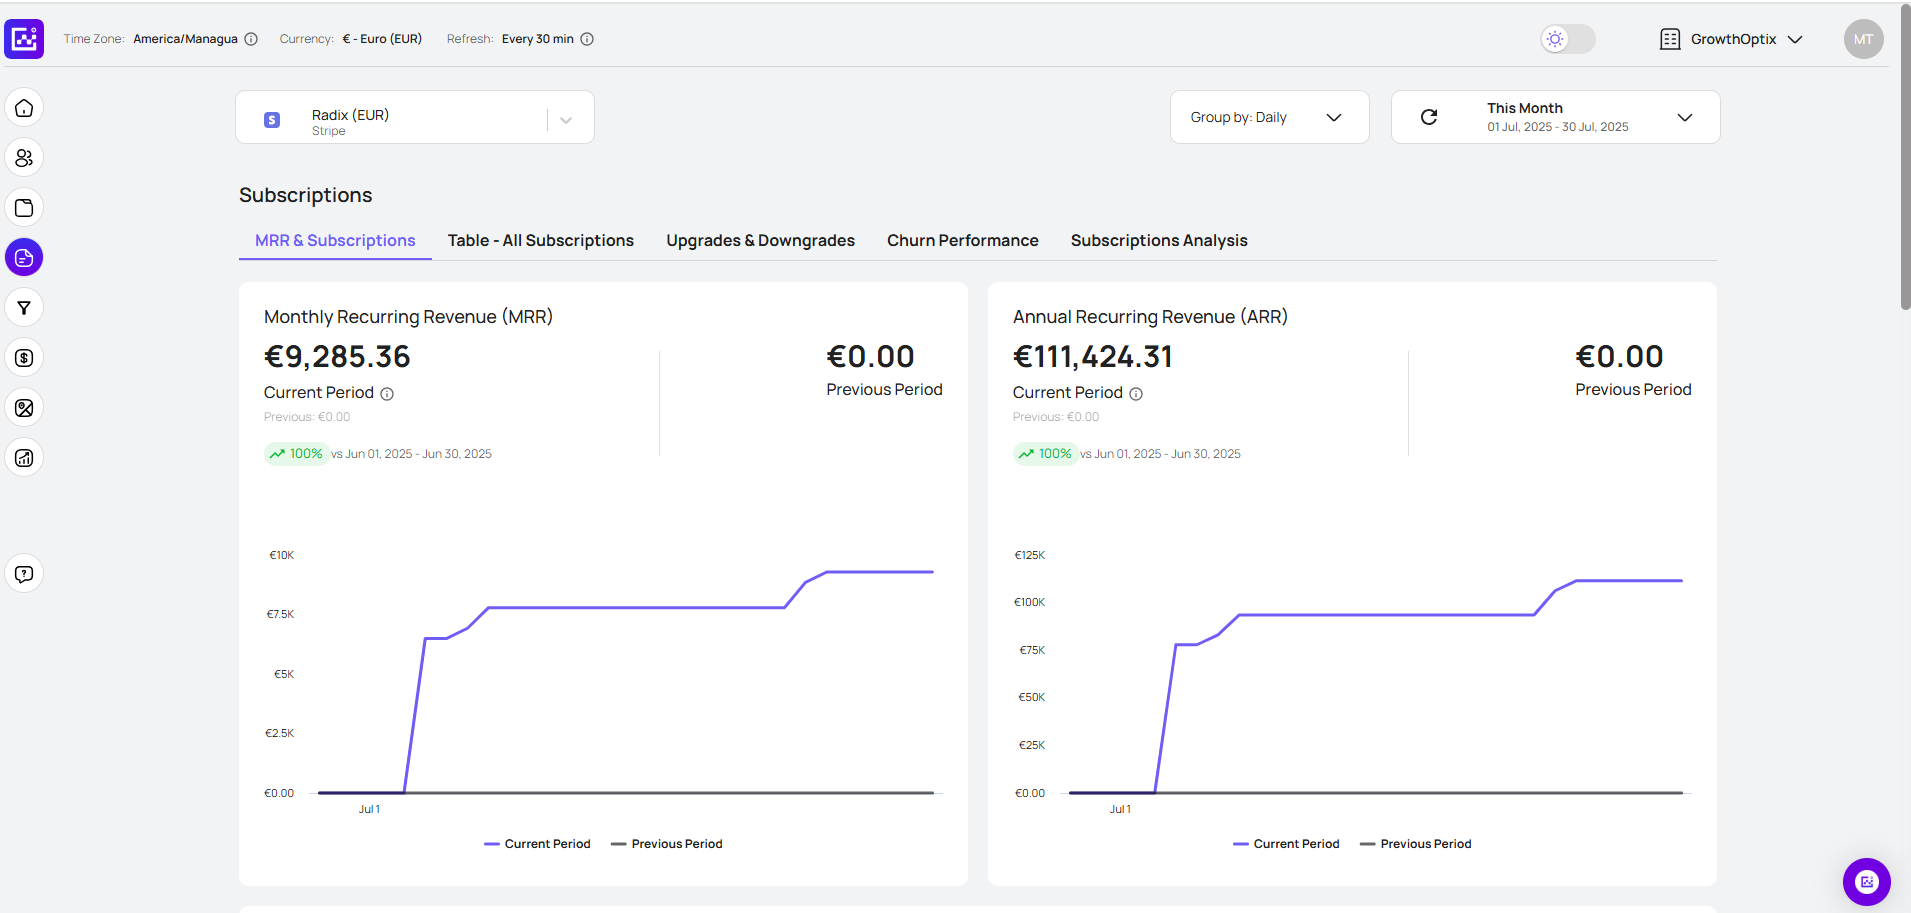
Monthly Recurring Revenue (MRR) and Annual Recurring Revenue (ARR) form your measurement foundation, but recent changes make them more complex than traditional calculations suggest.
Battery Ventures discovered that 70% of SaaS companies now offer AI features with variable pricing components. This shift means your "recurring" revenue carries more unpredictability than the name implies.
Forward-thinking companies now separate ARR into two distinct categories. Committed ARR represents revenue you can count on regardless of customer usage patterns. Expansion ARR tracks growth from existing customers who purchase additional features or increase usage limits.
Companies above $50M ARR now generate 65% of their growth from existing customers rather than new acquisitions. This fundamental shift occurred gradually over three years, and many founders missed its significance completely.
Net Revenue Retention (NRR) has become the most reliable predictor of long-term business success. Bessemer's analysis of their Cloud 100 portfolio companies demonstrates that businesses with NRR above 120% achieve valuations 2.3x higher than those scoring below 110%.
Consider this strategic question: Would you prefer a business that grows by constantly acquiring new customers, or one where existing customers consistently increase their spending because they derive more value over time?
Customer Acquisition Cost (CAC) and Customer Lifetime Value (LTV) appear straightforward but require sophisticated analysis in today's SaaS environments.
The traditional 3:1 LTV to CAC ratio assumes customers behave predictably throughout their relationship with your company. AI-powered businesses see dynamic usage patterns that render old calculation methods obsolete.
Current market data reveals concerning trends. CAC increased 22% from 2022 to 2023, while the cost to expand existing customers jumped 45%. The assumption of "free growth" from your current customer base no longer holds true in most markets.
Payback Period has gained critical importance as capital costs increased. Companies recovering their CAC investment within 12 months achieved 40% faster growth rates in 2024 compared to those with longer payback cycles.
This raises a fundamental question about cash flow management: How long can your business afford to wait before recovering the money invested in each new customer acquisition?
Days Sales Outstanding (DSO) and Revenue Per Employee reveal how efficiently your operations convert effort into financial results.
Revenue per employee has increased materially among SaaS companies with less than $5M ARR, while stagnating or declining among larger, later-stage businesses. Early-stage companies below $1M ARR show median revenue per employee of $42K, rising to $90K for companies in the $1M-$5M range. AI tools enable small teams to accomplish work that previously required entire departments.
Billing Accuracy Rate and Invoice-to-Cash Time directly affect your cash flow dynamics. Companies that reduced their invoice-to-cash time by just 10 days improved overall cash flow by 15% on average. That improvement represents money available for growth investment rather than waiting in accounts receivable.
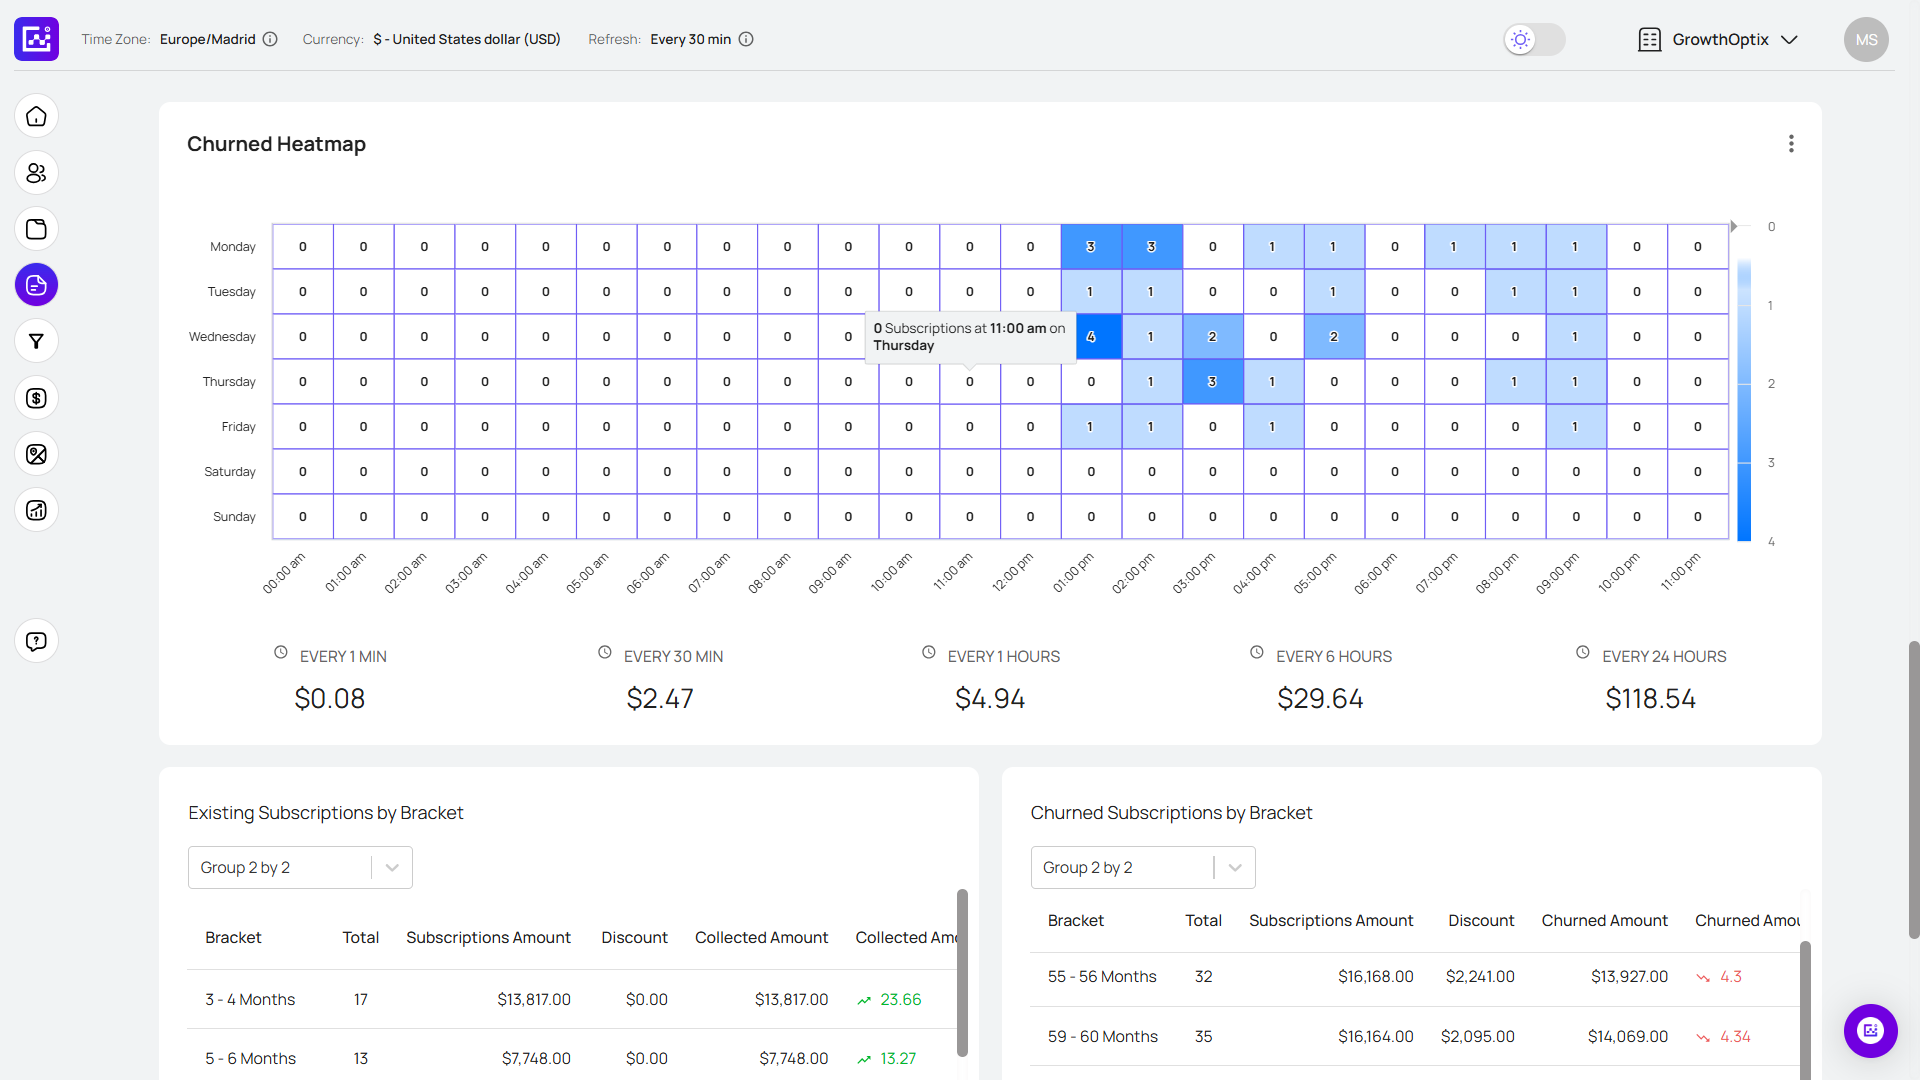
Churn Rate remains fundamental, but surface-level percentages provide limited actionable insight. Effective analysis requires segmentation by customer size, acquisition channel, product usage patterns, and engagement levels.
Companies implementing usage-based pricing models achieve 15% lower churn rates, but only when product usage correlates strongly with customer business value delivery.
Customer Health Scores now integrate product usage data, support ticket frequency, payment behavior patterns, and engagement metrics into predictive models. Companies using predictive health scoring reduce churn by 25% compared to reactive approaches that wait for customer complaints.
The critical strategic insight: Are you identifying potential problems before customers recognize them, or are you waiting for dissatisfaction to manifest in support tickets and cancellation requests?
The Rule of 40 has become the standard framework for measuring SaaS performance, but most companies apply it incorrectly — treating it as a single calculation when it's actually a stage-specific optimization tool.
The math is simple: add your growth rate percentage to your profit margin percentage. Totals above 40% indicate strong performance. Below 40% signals an optimization problem. McKinsey's research shows companies consistently scoring above 40% achieve median enterprise values three times higher than businesses below this threshold.
Where most founders go wrong is applying the same benchmark regardless of their business stage. Different stages require entirely different approaches.
Early Stage (Under $10M ARR)
Prioritize growth over profitability. Target 60%+ growth rates even when operating with negative margins. Investors at this stage want evidence of market validation and product-market fit, not near-term profitability. A Rule of 40 score of 55 driven by 70% growth and -15% margin is far more interesting than a score of 40 driven by 20% growth and 20% margin.
Growth Stage ($10M–$50M ARR)
Balance becomes critical here. Optimize for sustainable growth while systematically improving unit economics to demonstrate scalability. You should be able to articulate a clear path to profitability even if you haven't arrived yet.
Mature Stage (Over $50M ARR)
Focus on balanced optimization — 30% growth rates and 15%+ profit margins. This combination proves long-term business model viability to investors and acquirers. AI-native companies currently average 52% on Rule of 40 calculations compared to 38% for traditional SaaS, but they require different optimization strategies given their variable cost structures.
The shift toward usage-based pricing represents one of the most significant changes in SaaS business models since the transition to cloud computing. This pricing model creates entirely new measurement challenges because traditional subscription metrics don't account for variable consumption patterns.
Companies adopting usage-based pricing need to track consumption patterns, predict variable costs, and align pricing with customer value realization in ways that subscription-only businesses never had to consider.
Usage-based pricing adoption reached 45% of SaaS companies in 2025, creating fundamental changes in how success gets measured and optimized.
Consumption Metrics track actual customer product usage and connect usage patterns to business outcome achievement. Companies with strong usage-value correlation achieve 122% Net Dollar Retention compared to 109% for traditional subscription-only models.
Unit Economics per Usage becomes crucial when operational costs scale directly with customer consumption. AI companies face particular challenges here as compute costs fluctuate dramatically based on customer usage intensity and patterns.
Predictive Usage Models help forecast revenue streams and capacity planning requirements. Companies implementing sophisticated usage forecasting improve gross margin predictability by 30% compared to reactive planning approaches.
This raises an uncomfortable but necessary question: Does your product usage actually correlate with customer success outcomes? If usage and value don't align, usage-based pricing might damage customer relationships rather than strengthen them.
Artificial intelligence has moved beyond being just another feature to becoming a fundamental component that changes how SaaS businesses operate and scale. This transformation creates measurement challenges that traditional SaaS metrics weren't designed to handle.
AI-powered features often have variable costs, unpredictable usage patterns, and value delivery mechanisms that don't fit neatly into subscription-based measurement frameworks. Companies need new approaches to track performance and optimize for sustainable growth.
AI represents more than another product feature. It fundamentally alters business model assumptions and measurement requirements.
AI companies reach $100M ARR in 6.3 years compared to 8 years for traditional SaaS businesses (according to Battery Venture) - representing 27% faster scaling. This acceleration comes with new measurement challenges that traditional metrics don't address.
AI Feature Performance Metrics must track adoption rates, value realization timelines, and customer outcome improvements. Companies measuring AI ROI for their customers report 40% higher expansion rates compared to those focusing solely on feature usage statistics.
Variable Cost Management becomes critical as AI features often carry compute costs that scale unpredictably with customer usage patterns. Traditional SaaS gross margins of 80%+ compress to 60-70% for AI-heavy product offerings.
Outcome-Based Metrics align billing structures with actual customer value delivery rather than feature access. Companies successfully implementing outcome-based pricing models report 35% higher customer satisfaction scores and 25% lower churn rates.
The ongoing challenge is that AI metrics continue changing rapidly. Measurement frameworks that work today might become obsolete within six months as AI capabilities and cost structures shift.
Even experienced SaaS leaders fall into predictable traps when implementing billing metrics systems. These mistakes often stem from copying what other companies do rather than understanding what their specific business model requires.
Recognizing these patterns early can save months of optimizing for the wrong outcomes and help you avoid the strategic missteps that derail otherwise promising businesses.
Growing MRR while ignoring unit economics resembles filling a bucket with a hole in the bottom. David Skok's foundational research demonstrates that companies optimizing for LTV:CAC ratios achieve more sustainable growth trajectories than businesses chasing pure revenue increases without regard to acquisition efficiency.
Comparing your usage-based pricing company to subscription-only businesses generates zero useful insights. Your business model determines which metrics matter most and what constitutes good performance within your specific context.
Your metrics function as interconnected systems rather than independent measurements. For a $50M ARR company, improving NRR by 10% typically creates more enterprise value than improving growth rate by 10%.
Companies with strong metrics-to-action processes achieve 35% faster growth rates than organizations with sophisticated measurement capabilities but weak decision-making workflows.
Which of these patterns describes your current organizational approach to metrics analysis and implementation?
The gap between measurement and prediction is what separates thriving SaaS companies from struggling ones. You don't need more metrics. You need the right ones, connected to each other, with a clear process for turning what you see into what you do.
Start with Rule of 40 and NRR. Understand your CAC payback period. Build predictive health scoring into your customer success workflow. Everything else — the AI metrics, the usage-based adjustments, the operational efficiency benchmarks — layers on top of that foundation. Get the foundation right first.
Focus on balanced optimization
Join hundreds of SaaS companies who finally understand which marketing drives profitable growth.