March 9, 2026
ChartMogul Alternatives for Bootstrap Startups That Won't Break Your Budget

Written by
Content Marketing Manager


March 9, 2026
You're staring at spreadsheets again. Three Stripe dashboard tabs are open, you're manually calculating churn rates, and your co-founder just asked "What's our actual MRR?" for the third time this week.
This scenario plays out in thousands of startups. You need subscription analytics, but even with ChartMogul's free tier up to $120K ARR, their Pro plan at $99/month feels expensive when every dollar counts. Choose the wrong analytics tool and you'll either burn through cash or miss critical insights during important growth decisions.
After I analyzed price changes, feature gaps, and implementation costs across 15+ platforms, I found alternatives that won't break your bootstrap budget – and some surprising truths about which tools actually deliver value at your stage.
Think of subscription analytics as your business GPS. You wouldn't drive cross-country without your speed, fuel level, or direction. Yet many startups run on gut feelings instead of data when making critical business decisions.
You don't just need pretty charts. You need answers to keep-you-up-at-night questions:
Tracking core subscription metrics like MRR, churn rate, and customer lifetime value provides the foundation for data-driven decision making. But here's the catch: most analytics tools assume you have enterprise budgets and dedicated analysts.
You don't have time to become a data scientist, and you can't afford $500/month tools that require three weeks of setup. You need insights you can act on today, priced for where you are now, not where you hope to be in two years.
The subscription analytics world got turned upside down when Paddle acquired ProfitWell for $200+ million in 2022. Tools you relied on disappeared overnight while others jacked up prices, assuming they had you trapped.
Baremetrics significantly increased their pricing in April 2022 – their first price hike since 2013 – making it unaffordable for many bootstrap startups. Meanwhile, the subscription economy continues to shift toward usage-based and hybrid pricing models that demand more sophisticated analytics approaches.
If you use spreadsheets because "analytics tools are too expensive," you make decisions with outdated playbooks. The market has split into two camps: expensive enterprise platforms and genuinely bootstrap-friendly alternatives that didn't exist three years ago.
What does this mean for you? More options at your price point, but also more complexity in choosing the right fit. The tools that worked for startups in 2022 might be completely wrong for your 2025 reality.
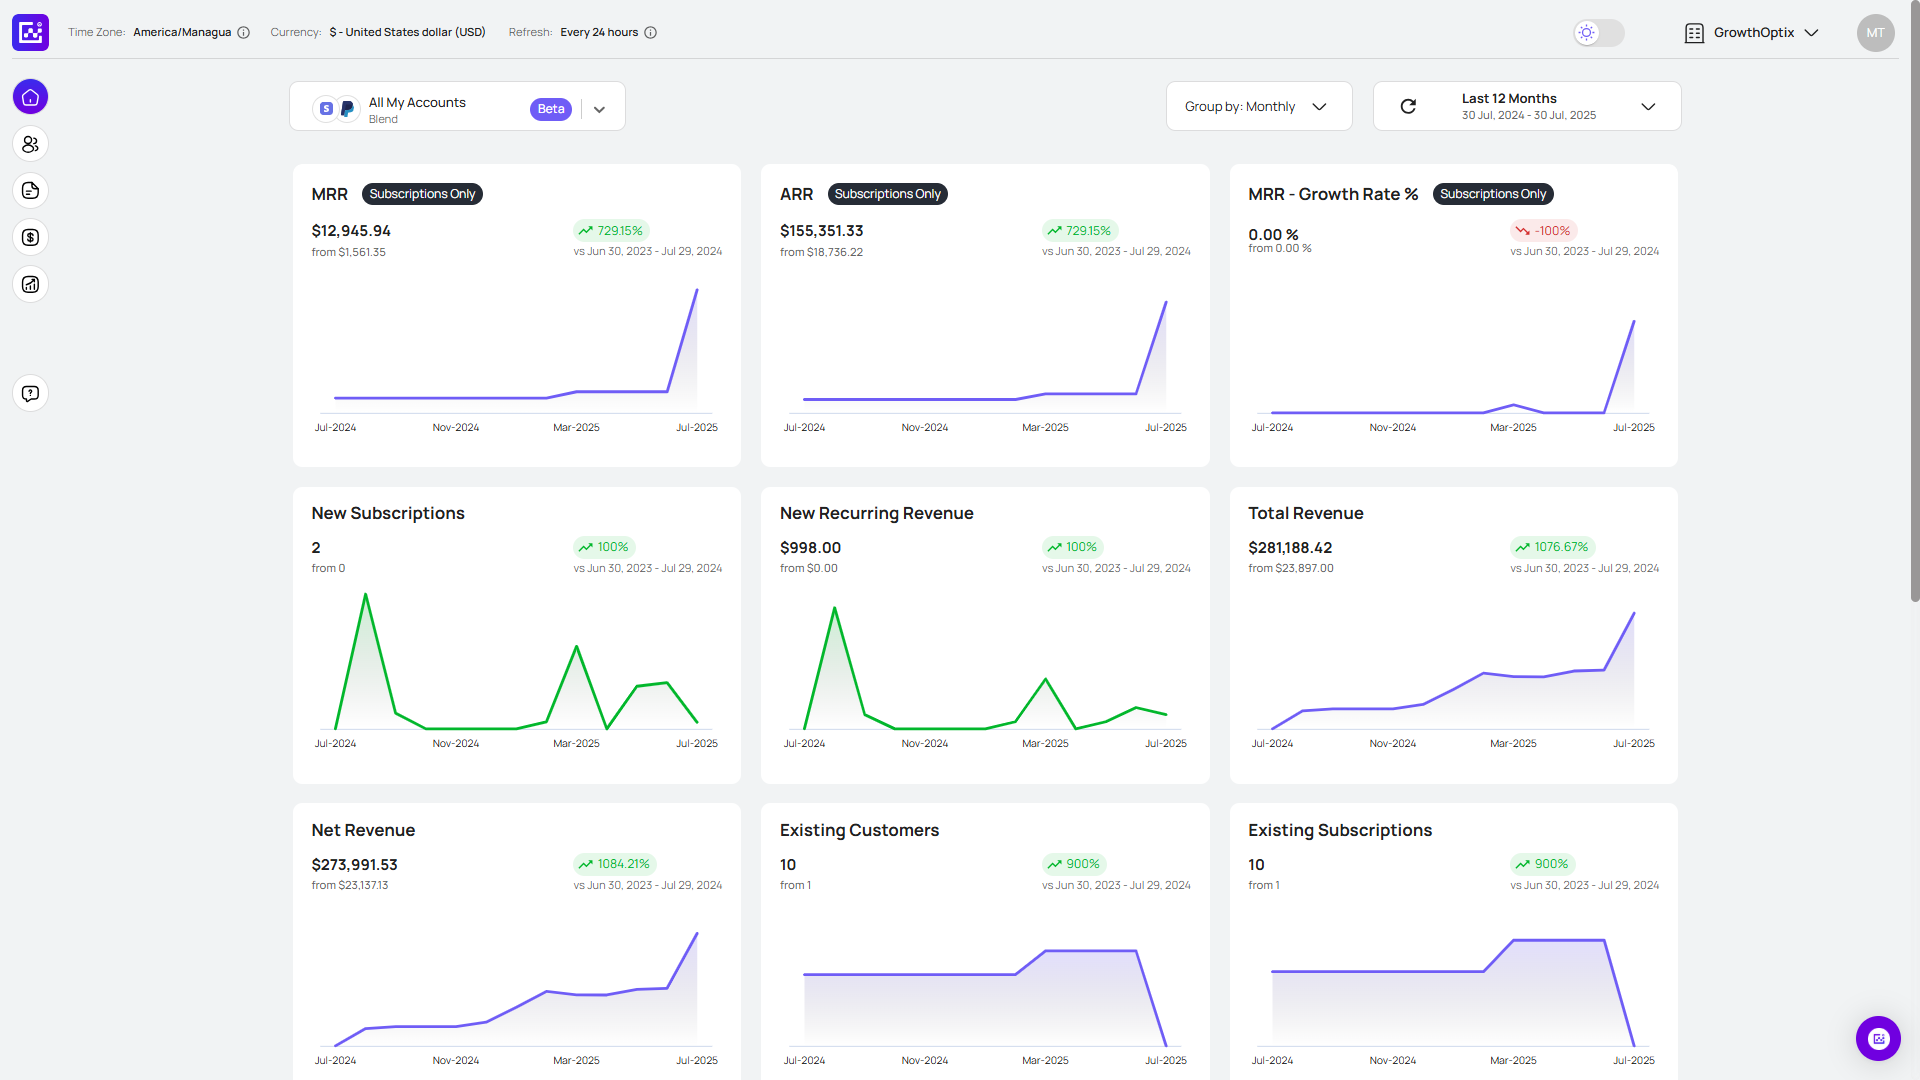
Best if you use both PayPal and Stripe and want AI-powered revenue forecasting
You juggle PayPal and Stripe accounts, manually combining data from both platforms to understand your real revenue picture. GrowthOptix subscription analytics platform, solves this specific pain point by being one of the few platforms with official partnerships with both PayPal and Stripe.
Dual-platform advantages:
Price: Free for businesses under $20K MRR, then usage-based pricing that scales with growth
Setup time: Under 10 minutes for both integrations combined
AI-powered features: Revenue forecasting, churn predictions, and expansion revenue opportunities through natural language queries
GrowthOptix makes sense if you run payments through both PayPal and Stripe and want AI insights without building custom solutions. The free tier up to $20K MRR makes it accessible for early-stage startups, while the AI features provide value that simple analytics tools miss.
Skip GrowthOptix if: You only use one payment processor or prefer traditional dashboards over AI-powered insights.
Do you currently spend time manually combining PayPal and Stripe data, or would AI-powered revenue forecasting change how you plan growth?
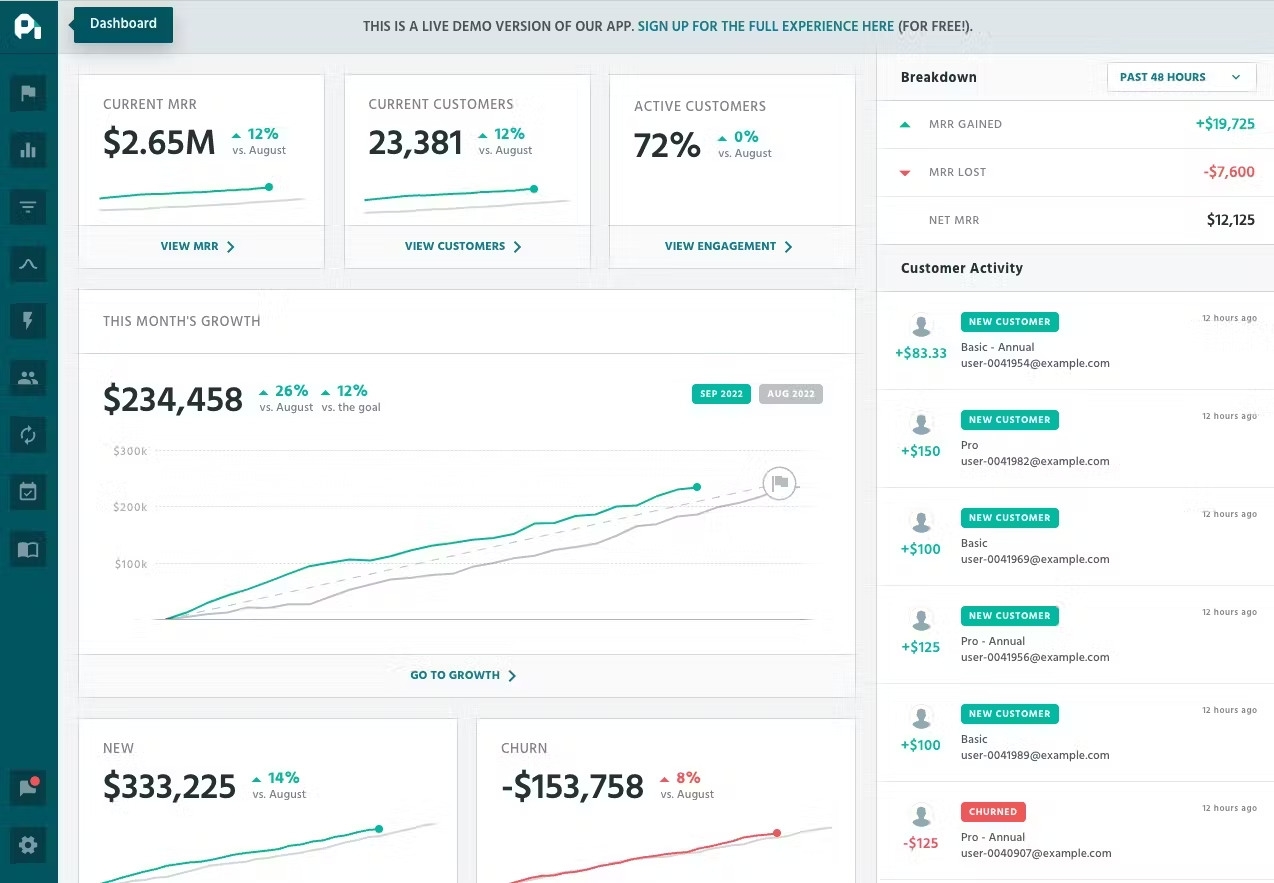
Best if you want churn reduction tools with basic analytics
You don't want to pay for analytics when your main problem is losing customers. Paddle Retain (formerly ProfitWell) has shifted focus post-acquisition to become primarily a retention platform rather than a broad analytics tool.
What you get:
Price: Pricing isn't publicly listed; contact for custom quotes
Integration setup: Works with major billing platforms including Stripe, Chargebee, and Recurly
The post-acquisition focus means you get stronger retention tools but fewer general analytics features compared to the old ProfitWell. If your main goal is reducing churn rather than comprehensive business intelligence, this shift might actually benefit you.
When to consider: Once you have established revenue and losing customers becomes your biggest pain point.
What matters more to your current situation: understanding your overall business metrics or stopping customers from leaving?

Best if you have budget flexibility and your team values excellent user experience
You've probably seen Baremetrics screenshots in every SaaS blog post. There's a reason: their dashboards are absolutely stunning. Clean design, intuitive navigation, and insights that actually make sense at first glance.
Why teams love it:
Current pricing structure:
The bootstrap calculation: At $25K/month revenue, even their lowest tier represents a significant percentage of monthly income – money that could go toward growth instead.
Customer reviews consistently praise the user experience but cite cost as the primary concern for smaller businesses. You essentially pay a premium for design and ease of use.
Consider Baremetrics if: Beautiful dashboards motivate your team to check metrics more often, and you have substantial budget allocated for analytics. Skip it if you count every dollar or prefer substance over style.
Which matters more to your current situation: saving money for growth investments or having the prettiest analytics dashboard?
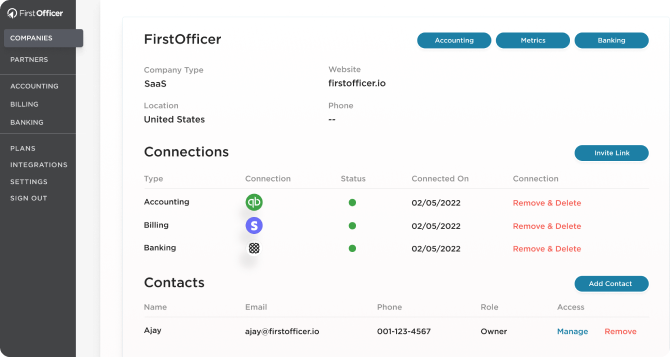
Best if you use Stripe exclusively and want straightforward subscription analytics
You're tired of Stripe's basic dashboard but don't need every bell and whistle that enterprise tools offer. FirstOfficer.io focuses exclusively on Stripe businesses, which means deeper insights into payment-specific metrics that broader platforms miss.
Stripe-focused advantages:
Price: Plans start at $29/month (Hobby tier) up to $249/month (Business), with 30-day free trial
The limitation: You're locked into Stripe forever. If you want to add PayPal, Apple Pay, or other processors later, FirstOfficer.io won't help.
FirstOfficer.io works best if Stripe handles all your transactions and you want analytics that actually understand payment nuances. If you're platform-agnostic or plan to diversify payment methods, look elsewhere.
Are you committed to Stripe long-term, or do you need flexibility to add other payment processors as you scale?
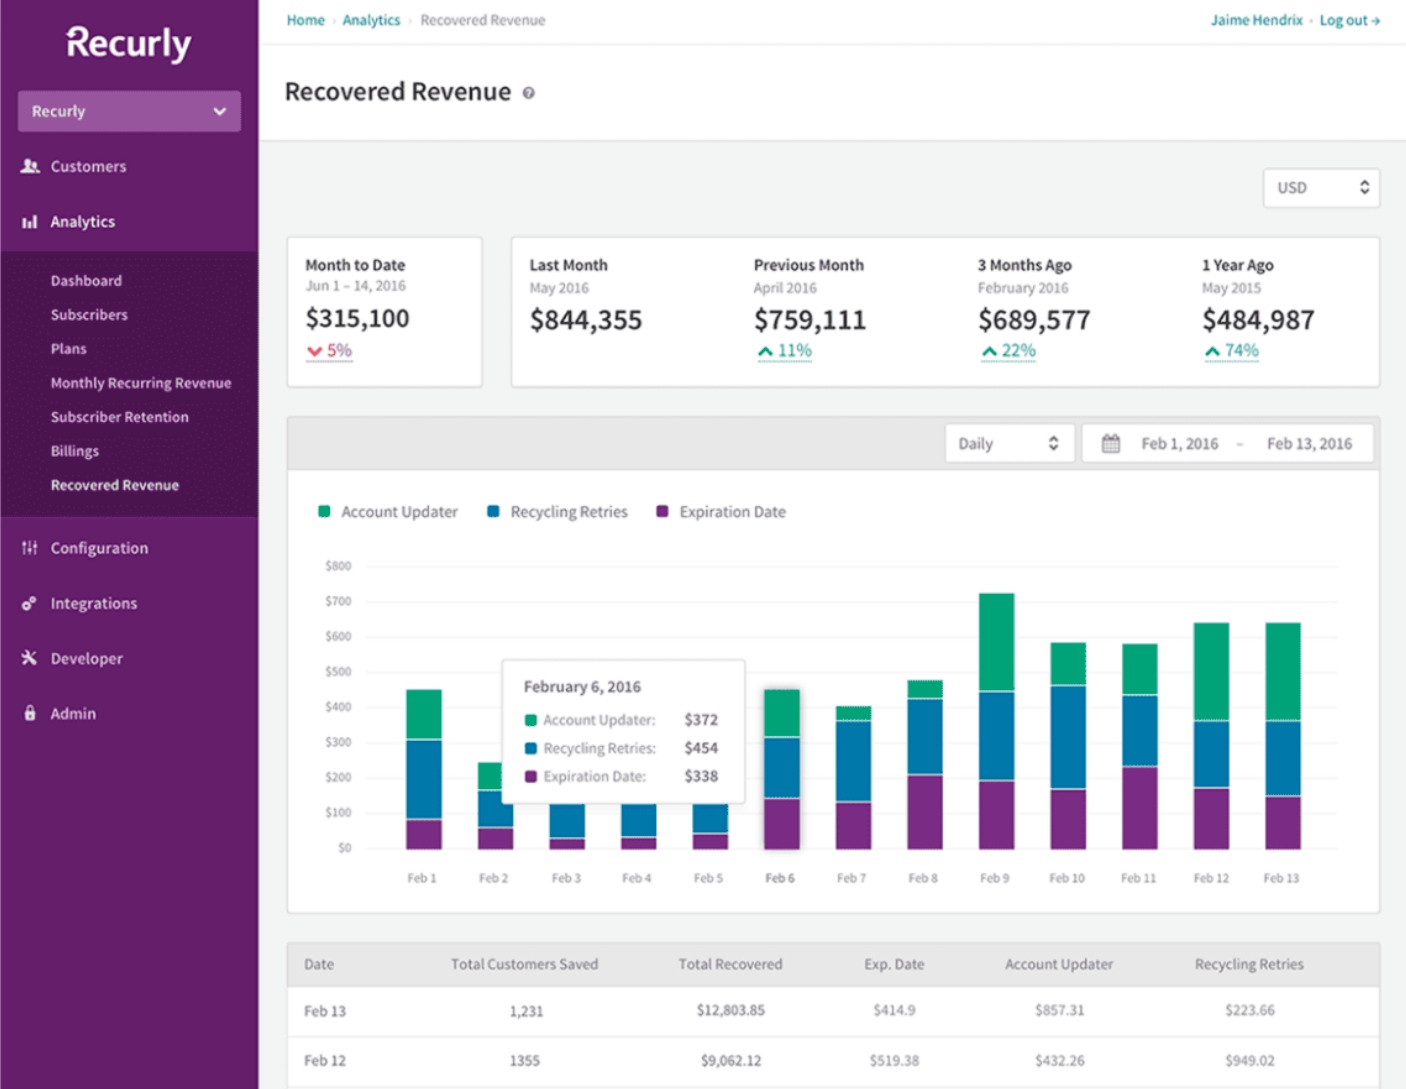
Best if you need subscription billing plus analytics and can handle complex pricing
You currently use separate tools for billing and analytics, paying twice and dealing with integration headaches. Recurly combines both, which sounds efficient until you examine the full cost structure.
All-in-one benefits:
Price: Contact for current pricing; plans typically include base fees plus percentage charges that scale with revenue
The pricing structure combines subscription costs with usage-based fees. Without publicly available 2025 pricing details, you'll need to contact Recurly directly to understand the total cost at your revenue level.
UniBee's 2025 Recurly analysis confirms what many startups discover: the combination of base fees and percentage pricing gets expensive quickly.
Consider Recurly if: You need enterprise billing features and the combined pricing works out favorably at your scale. Skip it if you're happy with Stripe and just need better analytics.
How much are you currently spending on separate billing and analytics tools? Would combining them actually save money at your revenue level?
Best if you have developer resources and want analytics that grow with your entire business
You're frustrated by the limitations of purpose-built subscription tools. Your business has unique metrics, custom reporting needs, and a technical team that can handle more complexity for better long-term flexibility.
Open-source advantages:
Cloud hosting: Starts at $85/month for the hosted version
Setup: Budget 2-4 weeks of developer time to build subscription-specific dashboards and connect your data sources properly.
Technical requirements: SQL knowledge for custom queries, server management if self-hosting, ongoing maintenance for updates and backups.
Metabase makes sense if you have technical resources and want analytics that extend beyond just subscription metrics. If SQL scares your team or you need insights next week (not next month), choose a purpose-built tool instead.
Do you have 40+ hours of developer time to invest in custom analytics setup, or do you need insights working immediately?
Best if you're already in the Microsoft ecosystem and want powerful analytics
You need more than basic subscription analytics but can't afford traditional enterprise BI tools. Power BI provides serious analytical capabilities at a price that won't devastate your runway.
Microsoft ecosystem benefits:
Price: $14/user/month for Power BI Pro (increased from $10 in April 2025) makes it cost-effective for small teams
Learning curve: Expect 1-2 weeks to build subscription-specific dashboards. The interface is powerful but not intuitive for non-analysts.
Consider Power BI if: You already pay for Microsoft tools and have someone comfortable with data visualization. Skip it if you need plug-and-play subscription analytics.
How comfortable is your team with building custom dashboards, and are you already paying for Microsoft Office?

Best if you've outgrown simple tools but aren't ready for full enterprise complexity
You need more than basic subscription metrics but don't want the complexity of building custom solutions. Klipfolio bridges the gap with SaaS-specific features in a business intelligence platform.
SaaS-focused features:
Price range: Plans range from $120-600/month depending on features and data sources
Sweet spot: Growing startups with $200K+ ARR ready to invest in comprehensive analytics
Klipfolio works if you've outgrown simple tools but aren't ready for full custom solutions. If you're under $200K ARR, the cost probably isn't justified yet.
Are you spending significant time creating custom reports, or are basic subscription metrics still meeting your needs?
You wonder: "Should we just build our own analytics dashboard?" Let's do the math on what "just build it" actually costs.
Developer time investment:
Hidden complexity:
For startups under $200K ARR, this investment rarely pays off. Your developers' time generates more value building features customers will pay for, not internal dashboards.
Build custom analytics if: You have unique business model requirements that no existing tool handles well, and you have dedicated engineering resources.
Buy a purpose-built tool if: You need insights next month (not next quarter) and want to focus engineering time on your core product.
What's more valuable right now: spending 80 hours building analytics or 80 hours improving your product?
You don't have money to waste on fancy tools, but you need basic insights to make smart decisions.
Start here:
Avoid: Any tool over $100/month unless it directly saves you more time than that cost represents.
Upgrade when: You spend 4+ hours weekly on manual analytics, or you can't answer basic questions about customer behavior.
What's the one metric you check most often, and how long does it take you to calculate manually right now?
Manual tracking becomes painful, and you need insights to guide growth decisions. This is typically when analytics investment pays off.
Look for:
Budget guideline: 0.5-1% of monthly revenue on analytics tools
Key features: Customer segmentation, churn analysis, and revenue forecasting become critical at this stage.
Are you making growth decisions based on gut feeling because getting real data takes too long?
You need enterprise-ready features but aren't ready for enterprise complexity or pricing.
Essential capabilities:
Migration planning: Choose tools that handle 3x growth without forcing another switch. Tool migration costs weeks of productivity you can't afford.
Investment level: Up to 1% of revenue on analytics makes sense if it drives better decisions.
Can your current analytics setup handle doubling your customer base without breaking or becoming too expensive?
Think ecosystem, not just analytics. Your tool choice affects your entire data strategy.
Enterprise considerations:
Strategic questions: Will this vendor exist in three years? Can this tool scale to $10M+ ARR without major limitations?
How much of your leadership time goes to manually creating reports for stakeholders who need different views of the same data?
Skip the feature comparison charts. Ask these questions instead:
Upload 3-6 months of your actual transaction history (not clean demo data). Do the metrics match your spreadsheet calculations? If not, the tool's data model doesn't understand your business.
What's the total cost at 2x and 5x your current scale? Include setup fees, API access costs, and any usage-based pricing. Some tools have reasonable starter pricing but jump to enterprise costs with no middle ground.
Who will actually use this daily? Does it require SQL knowledge your team doesn't have? Will people check it regularly or forget it exists after the first week?
Can you export all your data if you need to switch tools? Test this before committing. Not being able to extract customer-level data creates expensive vendor lock-in.
Which of these factors would be a deal-breaker for yoYou Buy for Imagined Future Needsur current situation and team capabilities?
After I researched hundreds of startup tool migrations, these patterns destroy cash flow:
You test tools with clean demo data, then discover they can't handle your refunds, upgrades, billing failures, or customer timing quirks. Always test with actual historical data, including edge cases.
You choose enterprise features for problems you don't have yet. Focus on solving today's pain points, not theoretical future scenarios. You can always upgrade later.
You focus on current-tier pricing without mapping costs at 2x and 5x growth. Some tools have reasonable starter pricing but jump to enterprise costs with no middle ground.
You assume you can always export your data later, then discover customer-level exports cost extra or have formatting issues that make migration impossible.
Which of these mistakes sounds most likely to catch you based on how you usually evaluate tools?
You don't need perfect analytics. You need good enough analytics that improve your decision-making without draining your runway.
If you start with zero budget: Try GrowthOptix's free tier if you use PayPal and Stripe, ChartMogul's free tier (up to $120K ARR), or start with native payment processor dashboards.
If you have $50-100/month: Consider FirstOfficer.io for Stripe-only businesses or ChartMogul's Pro plan at $99/month.
If you have $200+/month and value design: Baremetrics provides excellent user experience with plans starting at $108/month for specific features, but verify current pricing matches your budget and needs.
If you need both PayPal and Stripe analytics with AI insights: GrowthOptix provides unified dashboards and AI-powered forecasting at transparent pricing.
If you have technical resources: Metabase offers maximum flexibility for teams that can invest setup time.
The biggest mistake isn't choosing the wrong tool – it's spending weeks analyzing options instead of getting insights that help you grow.
What's the one question about your business that you can't answer today because you don't have the right data? Start there, choose a tool that answers that question, and worry about perfect analytics later.
Your startup's success depends on understanding customers well enough to build something they can't live without. Pick tools that accelerate that understanding without burning the cash you need to make it happen.
Join hundreds of SaaS companies who finally understand which marketing drives profitable growth.