March 4, 2026
CMO Metrics That Actually Matter for Growing Startups When Every Dollar Counts

Written by
Content Marketing Manager


March 4, 2026
You're staring at three different dashboards, and none of them answer the one question keeping you up at night: "Is my marketing actually working?"
Your Google Analytics shows 50,000 monthly visitors. Your social media engagement looks decent. Email open rates hit 25%. But your bank account tells a different story, and you're burning through cash faster than you're bringing in revenue.
Here's what 92% of startup founders discover the hard way: vanity metrics feel good but don't pay bills. McKinsey's latest research reveals a brutal disconnect where 70% of CEOs measure marketing success by revenue growth, while only 35% of CMOs track this metric. This gap isn't academic—it's why 90% of startups fail within their first five years.
The companies that survive? They track five specific metrics. These metrics directly connect marketing spend to cash flow. They make weekly decisions based on real data, not gut feelings.
Let's fix your measurement system today.
Traditional CMO metrics assume you have dedicated analysts, unlimited testing budgets, and six months to see results. You don't. You need metrics that work when you're the founder, marketer, and accountant all at once.
Enterprise companies can afford to track brand awareness and customer sentiment. You need to know whether last week's $500 ad spend will help you make payroll next month.
Research across 2,500 SaaS companies shows bootstrap startups operate at 85% breakeven or profitability. Compare that to just 46% of VC-backed companies. This fundamental difference shapes which metrics actually matter for your business.
When every marketing dollar comes from revenue you've already earned, you can't afford to chase metrics that don't directly impact your ability to grow sustainably. Think about your current situation right now. Are you tracking metrics that help you decide where to spend your next $1,000 in marketing? Or are you collecting data that makes you feel good but doesn't change your behavior?
Your biggest pain point right now is probably the same as every other bootstrap founder. You have limited cash, limited time, and unlimited pressure to make every decision count. You can't afford to spend three months testing a marketing channel that doesn't work.
What if you could know within weeks whether your marketing investment will pay off? The metrics you choose determine whether you're making decisions based on real business impact or just chasing numbers that make you feel good.
Stop tracking everything. Start tracking what matters.
Companies that monitor more than 30 metrics experience analysis paralysis. They make slower decisions than competitors who focus on essential measurements. Your pain point is that you're drowning in data but starving for insights.
You know something's working because you're still in business. But you don't know what's working well enough to double down on it. You don't know what's failing early enough to cut it before it drains your budget.
These five metrics solve that problem:
They connect every marketing activity to business outcomes. They show you where to invest more and where to cut losses. They answer the questions that keep you up at night.
This number tells you exactly how much you're spending to acquire each new customer. Industry data for 2025 shows B2B SaaS companies average $395 CAC, while B2C eCommerce averages $298.
Your pain point with CAC is probably that it keeps going up. You started with $50 CAC when you were scrappy and personal. Now it's $200 and climbing. You're spending more to get the same customers. Your margins are shrinking and your growth is becoming unsustainable.
CAC tells you whether your marketing is getting more efficient or less efficient over time. If it's increasing, you're scaling problems instead of solutions. If it's decreasing, you're getting better at finding and converting your ideal customers.
But here's what those benchmarks miss. Your CAC should decrease over time as you optimize messaging and channels. If it's increasing, you're scaling inefficiency instead of growth.
Calculate your real CAC by including everything. Ad spend, tool costs, content creation time, and your personal hours. Most founders forget to value their own time. This leads to artificially low calculations and poor investment decisions.
Take Sarah, who runs a project management SaaS. She spent $3,000 on Google Ads and $200 on design tools. She also spent 30 hours creating landing pages (valued at $100/hour).
Her real calculation looked like this:
Without including her time, she would have calculated $267. She was completely missing the true cost of acquisition.
CAC solves your biggest marketing problem. It tells you whether you can afford to scale. If your CAC is $300 and your average customer pays you $100 monthly, you need at least three months to break even. If customers typically stay for 12 months, you're profitable. If they churn after six months, you're losing money on every customer.
How long are your customers staying with you right now? Does that timeline make your current CAC profitable or problematic?
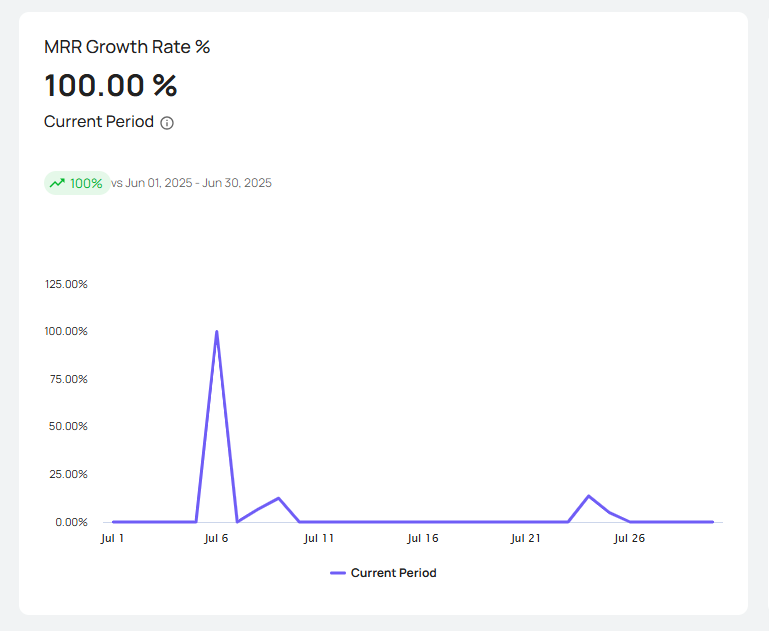
For any subscription or recurring business model, MRR growth rate determines whether you're creating sustainable momentum or just creating temporary spikes.
Your pain point with growth is probably inconsistency. Some months you add $10,000 in new MRR. Other months you add $2,000. You can't predict cash flow, plan hiring, or make strategic decisions when your growth bounces around randomly.
MRR growth rate smooths out those fluctuations and shows you the underlying trend. Are you actually growing consistently? Or are you just having good and bad months? Is your growth accelerating as you get better at marketing? Or is it slowing down as you exhaust easy opportunities?
SaaS Capital's 2025 survey of companies with $3M-$20M annual recurring revenue shows median growth rates dropped to 20% from 30% in 2024. The survivors focused on sustainable growth rather than unsustainable acceleration.
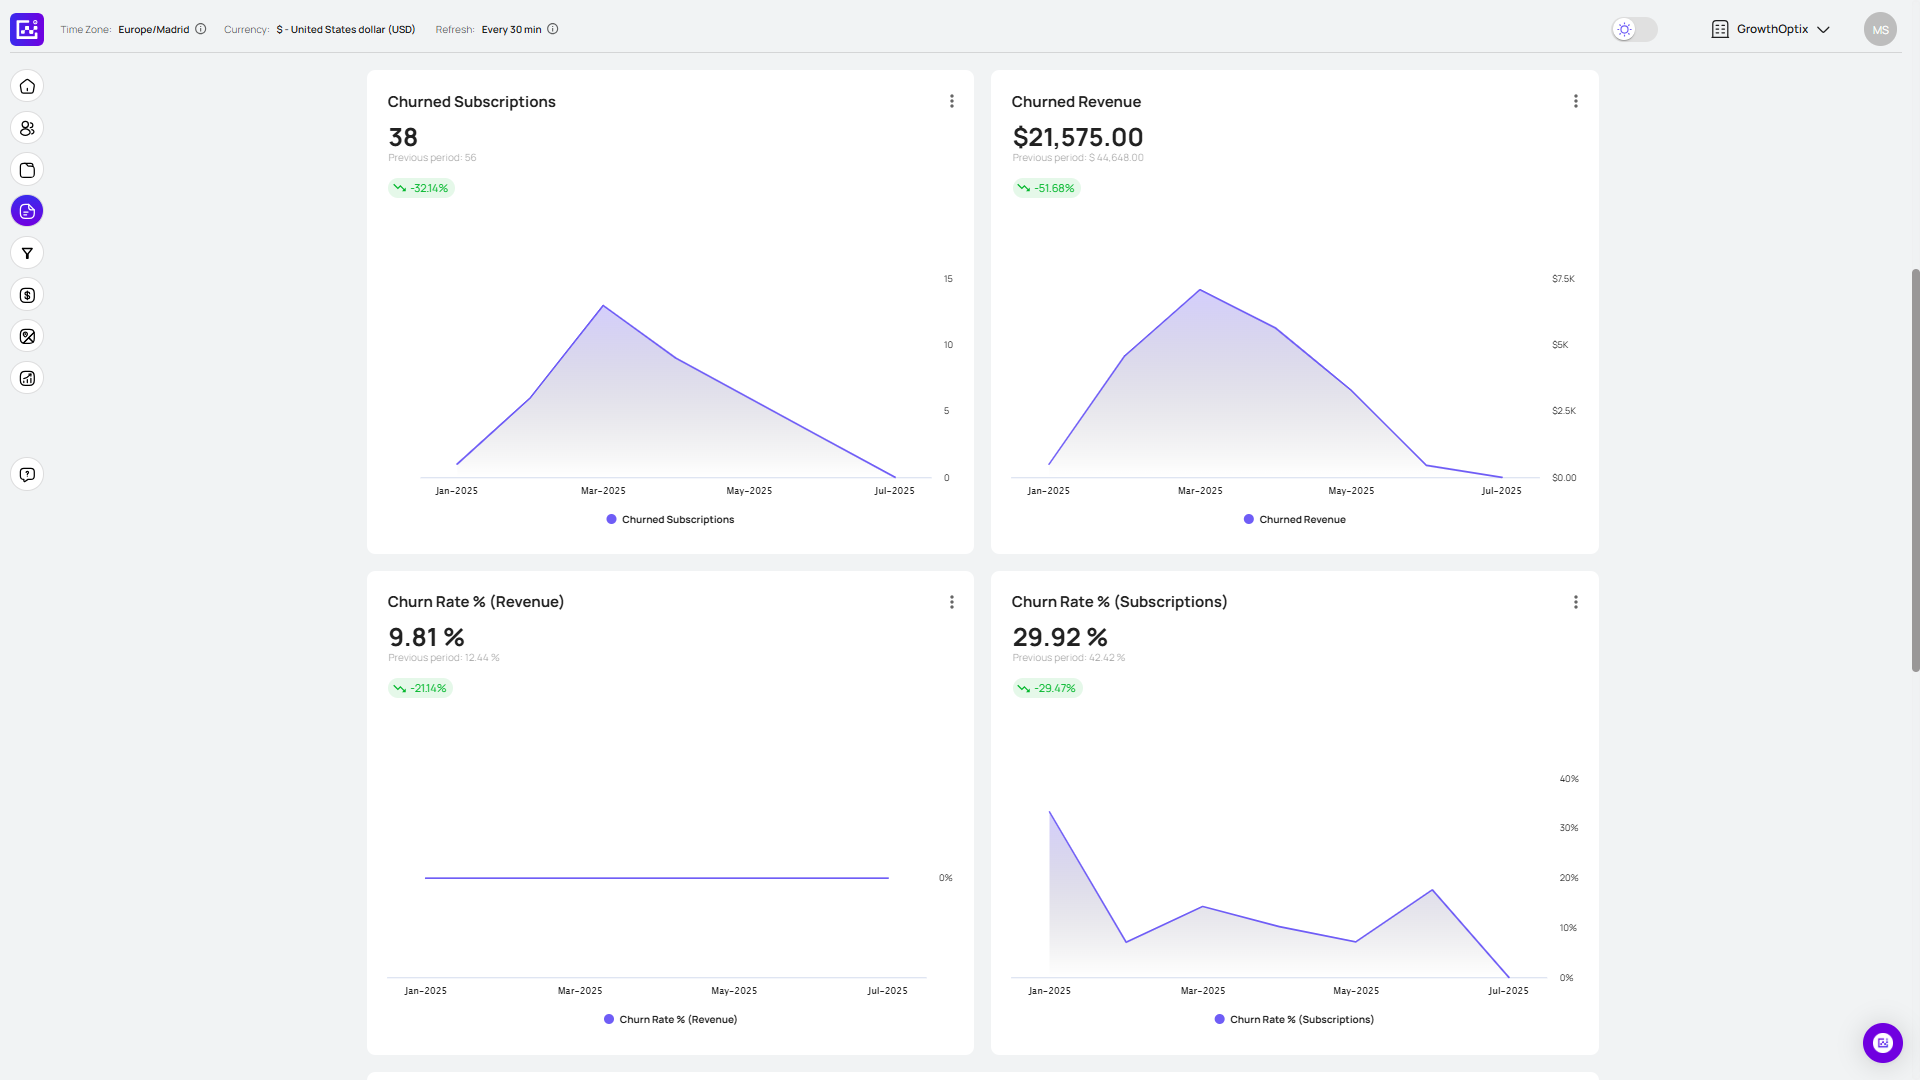
MRR growth rate also reveals the quality of your growth. Let's say you're adding $5,000 in new MRR but losing $3,000 to churn. Your net growth is only $2,000. That's completely different from adding $5,000 with minimal churn.
The first scenario suggests product or customer fit problems. The second suggests healthy, scalable growth. Which scenario describes your business right now?
Track these components separately:
This breakdown shows whether growth comes from new customer acquisition, existing customer expansion, or simply reducing churn. Each source requires different strategic approaches.
Healthy bootstrap startups target 10-15% monthly growth. VC-backed companies face pressure for 20%+ monthly growth, but this often leads to unsustainable unit economics.
The real value of MRR growth rate is that it forces you to think about the sustainability of your business model. Can you maintain this growth rate for 12 months? What would happen to your cash flow if growth slowed to half the current rate? Those questions determine whether you have a business or just a temporary revenue stream.
Instead of complex lifetime value calculations requiring years of data you don't have, focus on payback period. This shows how long it takes to recover your customer acquisition investment.
Your pain point with cash flow is probably the lag between spending money on marketing and seeing that money return as revenue. You spend $1,000 on ads today. Those customers might pay you back over six months. Meanwhile, you still need to pay rent, payroll, and other expenses.
Payback period tells you exactly how long your money is tied up in customer acquisition. If your payback period is three months, you need enough cash reserves to operate for three months while waiting for marketing investments to return. If it's 12 months, you need a year of runway for every marketing dollar you spend.
Bootstrap companies should target payback periods under six months for sustainable growth. VC-backed companies can afford longer periods because external funding provides runway. But bootstrap founders need positive cash flow quickly.
Calculate payback period by dividing CAC by average monthly revenue per customer. If your CAC is $400 and customers pay $100 monthly, your payback period is four months. That's well within the safe zone for bootstrap growth.
Mike's consulting business had a $600 CAC with $150 monthly client value. This created a four-month payback period. When he optimized his sales process and reduced CAC to $450, payback dropped to three months. This dramatically improved cash flow and allowed faster reinvestment in growth.
Payback period also helps you evaluate marketing channels fairly. Channel A might have higher upfront costs but faster payback. Channel B might look cheaper initially but take longer to recover your investment. Payback period shows you the true cost of each customer acquisition channel.
What's your current payback period? Are you comfortable with how long your money stays tied up in customer acquisition?
The psychological benefit of tracking payback period is that it turns marketing from an expense into an investment. When you know you'll recover every marketing dollar in four months, spending on marketing feels like putting money in a savings account. When payback takes 18 months, marketing feels like gambling with your business.
Not all traffic converts equally. Not all channels deserve equal investment. Track conversion rates separately for each marketing channel to identify where your next dollar should go.
Your pain point with marketing channels is probably that you're spreading your efforts too thin. You're posting on social media, running Google ads, doing email marketing, trying SEO, and writing blog content. But you don't know which activities actually drive customers and which ones just keep you busy.
Conversion rate by channel solves this problem. It tells you exactly which marketing activities turn browsers into buyers. It shows you where to double down and where to cut losses. It reveals the difference between marketing that generates activity and marketing that generates revenue.
Research shows B2B conversion rates average 2.4% while B2C achieves 2.8%. But channel quality varies dramatically. Email marketing might convert at 5% while social media converts at 0.5%. Knowing this difference determines your entire marketing strategy.
Most founders discover that their assumptions about channel performance are completely wrong. They think social media is their best channel because it generates the most engagement. But email converts five times better. They assume Google ads are expensive because of high cost-per-click. But Google traffic converts at twice the rate of social traffic.
Fill in your actual conversion rates. Which channels deserve more of your time and budget? Which ones are you over-investing in relative to their performance?
Many startups discover their best customers come from their worst-performing channels in terms of volume. But these channels are best-performing in terms of quality. Volume doesn't equal value.
The strategic value of conversion rate by channel is that it helps you make resource allocation decisions. If email converts at 5% and social converts at 1%, you should spend five times as much effort on email for the same return. If organic search converts at 3% and paid search converts at 2%, organic deserves more investment even though paid delivers faster results.
Conversion rate by channel also reveals market feedback about your positioning. If direct traffic converts at 8% but referral traffic converts at 2%, your existing customers love you but your broader market messaging isn't working. If paid search converts well but organic search doesn't, your ads are compelling but your content needs work.
This ratio shows whether your marketing generates positive returns or burns cash. Calculate total marketing-generated revenue divided by total marketing spend for the same period.
Your pain point with marketing ROI is probably that you can't prove marketing is profitable. You know marketing drives some revenue. But you can't separate marketing-generated revenue from organic growth, referrals, or repeat purchases. This makes it impossible to justify marketing spend or optimize marketing strategy.
Revenue-to-marketing spend ratio cuts through the confusion. It shows you exactly how much revenue your marketing generates for every dollar you invest. A 3:1 ratio means every marketing dollar generates $3 in revenue. A 1:1 ratio means you're breaking even. Below 1:1 means you're losing money on marketing.
Bootstrap companies should target 3:1 or higher ratios to maintain sustainable growth. Lower ratios might work short-term for customer acquisition. But they'll drain your resources if sustained too long.
Track this ratio monthly and quarterly to identify seasonal patterns and long-term trends. A declining ratio signals either increasing competition, decreasing conversion efficiency, or targeting problems that need immediate attention.
Let's say you spent $5,000 on marketing last month and generated $18,000 in new revenue. Your ratio is 3.6:1. That's healthy and sustainable. If you spent $5,000 and generated $4,000 in revenue, your ratio is 0.8:1. That's unsustainable and needs immediate fixing.
The business value of this ratio is that it connects marketing directly to profitability. When you know marketing generates $4 for every $1 invested, increasing marketing spend becomes an obvious decision. When the ratio drops to $1.50 for every $1 invested, you know to pause spending and fix conversion problems first.
This ratio also helps you evaluate marketing experiments fairly. New channels might have lower ratios initially as you learn how to optimize them. Established channels might show declining ratios as markets become saturated. The ratio shows you when to invest, when to optimize, and when to abandon marketing activities.
What's your current revenue-to-marketing spend ratio? Is it trending up or down over the past three months?
The measurement environment shifted dramatically in recent years. Traditional tracking methods no longer work reliably.
Your pain point with measurement is probably that your marketing reports don't match your sales data. Facebook says your ads drove 50 conversions, but you only see 30 new customers in your CRM. Google Analytics shows 1,000 email clicks, but your email platform shows 800. Nothing adds up, and you can't trust any of the numbers.
This disconnect happened because privacy regulations broke traditional tracking methods. You're not going crazy. The data really is inconsistent now.
Apple's privacy updates reduced Facebook's attribution accuracy by approximately 50%. Google eliminated third-party cookies. Safari and Firefox block tracking by default. These changes affect 70% of web traffic and force different measurement approaches.
The practical impact on your business is that platform-reported numbers are now estimates, not facts. Facebook might claim your ads drove 40 conversions while your sales data shows only 25 new customers from that period. This discrepancy isn't an error. It's the new reality of privacy-first measurement.
Your pain point is that you can't rely on the numbers that marketing platforms show you. You need to combine platform data with your own sales data to get accurate pictures of performance. You need to track customers through your own systems instead of depending on third-party tracking.
How different are your platform numbers from your actual sales data right now? Are you making decisions based on inflated attribution numbers?
The solution is collecting data that belongs to you, not the platforms. Email addresses, phone numbers, customer surveys, and direct feedback create measurement systems that privacy regulations can't break.
Your pain point with first-party data is probably that it requires more work upfront. Platform tracking happened automatically. First-party data requires intentional collection, organization, and analysis. But it's the only measurement approach that remains accurate regardless of privacy changes.
Simple first-party data collection methods:
The competitive advantage of first-party data is that most companies are still relying on broken third-party tracking. Your measurement accuracy improves while competitors operate on increasingly unreliable data. Better measurement leads to better decisions. These compound into significant competitive advantages.
47% of US marketers now prioritize Marketing Mix Modeling over traditional attribution. MMM uses statistical analysis to understand which marketing activities drive results, rather than tracking individual customer journeys.
Your pain point with traditional attribution is that it oversimplifies customer journeys. Customers don't discover your company, research options, and purchase in a straight line. They bounce between channels, devices, and timeframes in ways that make individual journey tracking impossible.
MMM solves this by looking at correlations between marketing activities and business outcomes. Instead of trying to track individual customers, it identifies patterns in aggregate data. When you increase email frequency, does revenue increase? When you pause social media ads, do conversions decrease? MMM answers these questions without requiring perfect individual tracking.
For startups, this means thinking about marketing channels as a portfolio working together rather than competing for attribution credit. Some channels create awareness that others convert. Some build trust that others capitalize on. MMM helps you understand these relationships and optimize accordingly.
Your funding situation fundamentally changes which metrics matter most for your business.
The pain point for both bootstrap and VC-backed founders is the same. You're judged by the wrong metrics. Bootstrap founders get pressured to show hockey stick growth when they should focus on profitability. VC-backed founders get pressured to show immediate profitability when they should focus on market capture.
Understanding which metrics matter for your situation helps you optimize for the right outcomes. It also helps you communicate effectively with stakeholders.
Bootstrap companies spend approximately 95% of annual recurring revenue across all departments. This leaves little room for inefficient marketing spend. Your metrics must guarantee every dollar generates positive returns quickly.
Your pain point as a bootstrap founder is probably cash flow stress. You need marketing to pay for itself quickly because you don't have external funding to cover losses. You can't afford six-month experiments or brand awareness campaigns that might pay off eventually.
Critical metrics for bootstrap companies:
Monitor cash burn rate religiously. If you're spending $8,000 monthly on marketing and generating $12,000 in new revenue, you're creating sustainable growth. If those numbers reverse, you have weeks, not months, to fix the problem.
Bootstrap metrics help you avoid the growth trap. You could probably grow faster by spending more on paid advertising. But that growth wouldn't be sustainable with your current resources. Bootstrap metrics keep you focused on growth you can afford and maintain.
The psychological benefit of bootstrap metrics is that they create sustainable confidence. When you know every marketing dollar pays for itself within six months, you can invest in growth without the fear of running out of money. That confidence helps you make better strategic decisions and sleep better at night.
Are your current metrics helping you build a sustainable business? Or are they pushing you toward unsustainable growth?
VC-funded companies spend 107% of ARR because they optimize for market capture over immediate profitability. They invest 89% more on sales, 100% more on marketing, and 80% more on general expenses compared to bootstrap companies.
Your pain point as a VC-backed founder is probably growth pressure. Investors expect rapid scaling and market dominance. They want to see metrics that prove you're capturing market opportunity faster than competitors, even if that requires burning cash short-term.
Essential metrics for VC-backed companies:
VC metrics help you make the case for continued funding and higher valuations. They show investors that you're using their money to build a business that can dominate its market and return 10x their investment.
The key difference is clear. Bootstrap metrics answer "How do I build a profitable business?" VC metrics answer "How do I capture maximum market opportunity before competitors?"
VC-backed companies can afford longer payback periods, higher customer acquisition costs, and lower short-term profitability because they have external funding to bridge gaps. But they need to show that this investment creates sustainable competitive advantages and massive market opportunities.
Which funding model describes your situation? Are you tracking the right metrics for your path?
Benchmarks only matter if they improve your decision-making. Here are numbers that should influence your strategy.
Your pain point with industry benchmarks is probably that most are too generic to be useful. Average customer acquisition costs across all B2B companies don't help you evaluate your performance as a project management software company. You need specific benchmarks that relate to your business model, market, and customer type.
Source: HubSpot 2025 Benchmarks
Fill in your actual numbers. How do you compare to industry averages? More importantly, how do you compare to top quartile performers?
Keep in mind that your CAC should improve over time as you optimize targeting and messaging. If you're consistently above industry averages, focus on conversion optimization before increasing ad spend.
The strategic value of industry benchmarks is that they help you set realistic expectations and identify improvement opportunities. If your CAC is 50% higher than industry average, you know there's room for optimization. If your conversion rates are in the top quartile, you might have competitive advantages worth emphasizing.
Email marketing performance varies significantly by industry:
Compare your performance to relevant industry benchmarks, not generic averages. If your email open rates exceed industry averages but your conversion rates lag, you're good at getting attention but need to improve your sales process. If your CAC is below average but retention is poor, you're efficient at acquisition but need to work on product-market fit.
Where does your industry fall in these benchmarks? What's your biggest opportunity for improvement?
Let's examine the measurement errors that destroy businesses and how to avoid them.
Your pain point with metrics is probably that you're measuring the wrong things and optimizing toward failure. You're hitting your targets but missing your business goals. You're improving metrics that don't matter while ignoring metrics that determine survival.
Page views, social media followers, and email list size feel important but don't connect to revenue. 80% of CEOs distrust marketing efforts because marketers focus on engagement instead of business outcomes.
Your pain point with vanity metrics is that they create false confidence. You celebrate 50,000 monthly website visitors while your bank account dwindles. You're proud of 10,000 email subscribers while your customer acquisition stagnates. You feel like you're winning while your business slowly fails.
Ask yourself this question right now: does knowing you have 15,000 Instagram followers help you decide where to invest next month's marketing budget? Probably not. But understanding that email converts at 4% while social converts at 0.8% absolutely influences that decision.
Common vanity metrics that mislead founders:
Replace vanity metrics with business metrics. Instead of tracking total website visitors, measure qualified visitors who match your ideal customer profile. Instead of counting social followers, track social-generated leads and conversions.
The business impact of focusing on vanity metrics is that you optimize for the wrong outcomes. You create content that generates engagement but doesn't drive sales. You build audiences that feel impressive but don't convert. You waste time and money on activities that boost ego but don't boost revenue.
What vanity metrics are you currently tracking? How much time do you spend analyzing metrics that don't change your business decisions?
Many founders credit the last touchpoint before a sale. This ignores the entire customer journey and creates poor channel investment decisions.
Your pain point with attribution is probably that you're over-investing in channels that get credit for closing sales but under-investing in channels that create initial awareness. Last-click attribution makes the bottom of your funnel look incredibly efficient while making the top of your funnel look worthless.
Consider this customer path:
Last-click attribution gives all credit to email marketing. But what really drove that sale? The podcast created initial awareness. Google research built credibility. Blog content established expertise. Email just happened to be the final touchpoint.
The business impact of attribution confusion is that you cut marketing activities that actually drive growth. You might eliminate podcast advertising because it doesn't get credit for direct conversions. But podcast advertising creates the awareness that makes all other marketing more effective.
Start thinking about marketing as an integrated system where channels work together. Some create awareness, others build trust, and different ones drive conversions. Optimize the system, not individual components.
Which marketing channels are you currently under-valuing because they don't get last-click attribution credit?
Tracking dozens of metrics without clear priorities leads to delayed decisions and missed opportunities. Research shows that companies monitoring more than 30 metrics make slower strategic decisions than focused competitors.
Your pain point with analysis paralysis is probably that you spend more time analyzing data than acting on insights. You create elaborate reports that nobody reads. You track metrics that don't change your behavior. You postpone decisions because you want more data first.
The business impact of analysis paralysis is that you miss opportunities while competitors take action. You spend weeks analyzing whether to increase ad spend while competitors capture market share. You debate channel allocation while customers choose alternative solutions.
Signs you're trapped in analysis paralysis:
Build a weekly decision routine around your five core metrics. Spend 30 minutes every Monday reviewing numbers. Identify the biggest opportunity or problem. Decide what to test that week. Act on insights quickly rather than collecting more data.
Focus on metrics that change your behavior. If a metric doesn't influence decisions, stop tracking it. If you're not willing to change strategy based on metric results, the metric isn't worth measuring. Measure less, act more.
Your measurement system should serve your decision-making, not replace it. The goal isn't perfect information. It's better decisions made faster than competitors. Choose metrics that drive action, not metrics that satisfy curiosity.
How many metrics are you currently tracking? How many of those actually change your weekly marketing decisions?
Join hundreds of SaaS companies who finally understand which marketing drives profitable growth.