May 12, 2026
Marketing Attribution Models That Actually Work for B2B SaaS and Why Most Don't

Written by
Content Marketing Manager


May 12, 2026
You've been in this meeting. Someone says LinkedIn drove 47% of pipeline; someone else shows the CRM with Google Ads at 62%; a third person shares what customers actually wrote in their onboarding survey. Same business, same deals, wildly different answers.
So which number is right? Probably none of them.
This is the attribution problem in B2B SaaS. And no, the answer isn't to pick a fancier model. It's to understand what each model actually measures, where it breaks, and how to combine a few of them so you stop making budget calls based on whichever dashboard shouted loudest.
Marketing attribution is the set of rules you use to assign credit for a conversion to the marketing touchpoints that happened before it. That's it. It's not magic. It's not science. It's a credit-assignment policy.
And here's the part most articles skip: attribution measures correlation, not causation. Just because a prospect saw your LinkedIn ad before they bought doesn't mean the ad caused the purchase. They might have bought anyway.
Think about firefighters. Cities with more firefighters on scene tend to have more fire damage. Do firefighters cause damage? No. They respond to bigger fires. Attribution works the same way — it shows you what happened in sequence, not what actually drove the decision.
That distinction matters when you're about to cut spend on a channel because the dashboard says it's underperforming.
Your buyer isn't making an impulse purchase. They're going through a process that can take six to eighteen months with multiple stakeholders involved.
How complex is this? HockeyStack's analysis of 150 B2B SaaS companies found the average deal involves 266 touchpoints and 2,879 impressions. Dreamdata's LinkedIn Ads Benchmarks Report puts the average B2B journey at 211 days.
Two hundred and eleven days. Most attribution windows are 30.
That's not a measurement gap. That's a chasm.
There's another wrinkle: most B2B attribution tracks the lead, not the account. But B2B deals close because of buying committees, not individuals. The IT manager sees the LinkedIn ad. The CFO downloads the whitepaper. The VP of Engineering takes the demo. Track those as three separate "leads" and you get three separate attribution stories — none of them true.
This is why we built GrowthOptix's marketing attribution to tie touchpoints back to post-conversion SaaS revenue — MRR generated, retention, expansion, churn — instead of just "lead form submitted." The conversion event most attribution tools optimize for isn't the one that actually pays your salaries.
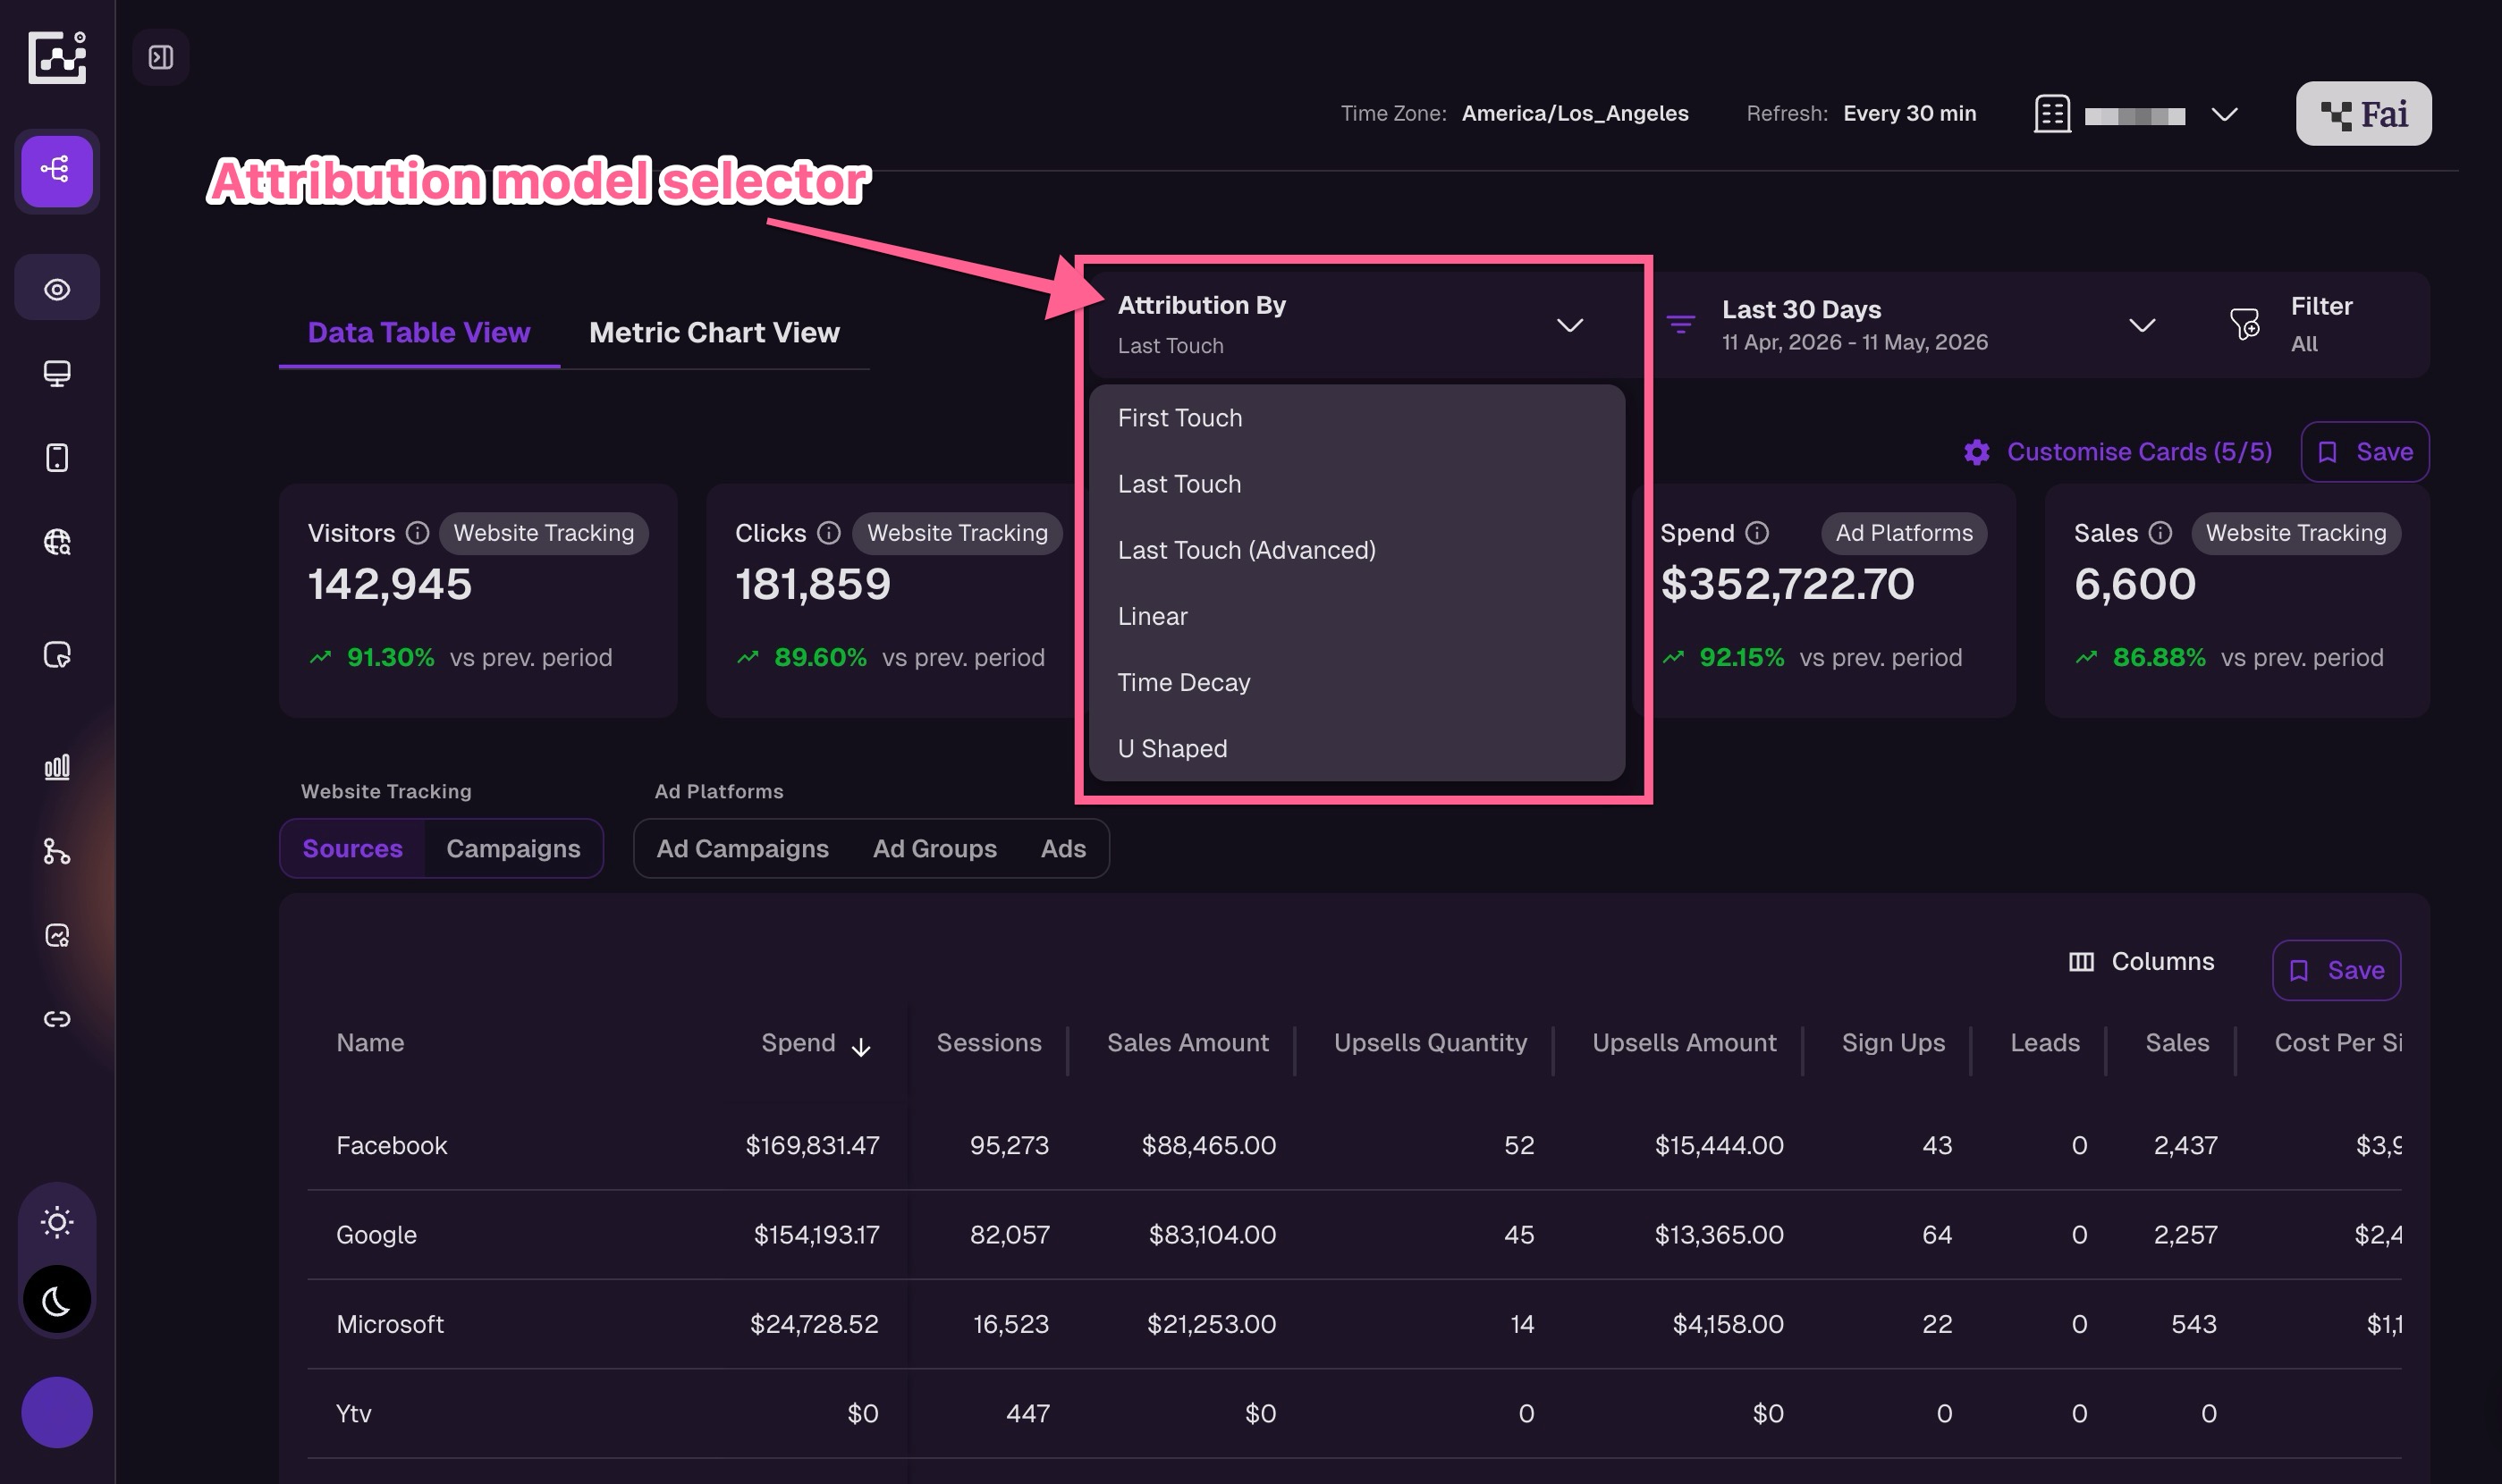
Most articles list four or five models, declare data-driven attribution the winner, and call it a day. That's wrong. There are useful single-touch models, useful multi-touch models, one specific refinement to last-touch that almost nobody mentions but materially changes ROAS analysis — and a couple of "advanced" models that sound great in conference talks and fall apart on real B2B data.
Here's the honest map.
First-touch gives 100% of the credit to whatever brought a prospect to you initially. If they found you through a Google ad, that ad gets everything — even if they later engaged with three emails, two webinars, and a sales call.
This is the model for answering one specific question: what's filling the top of my funnel? If you cut a top-of-funnel channel, first-touch is what tells you which channel went dark.
But in a 266-touchpoint journey, first-touch ignores 265 of them. Don't use it to allocate your full budget. Use it to find the awareness channels you're under-investing in.
Last-touch does the opposite: 100% credit to the final touchpoint before conversion. This was Google Analytics' default for years and it's still what most marketers fall back on, because it's easy.
Easy and wrong. Last-touch overvalues bottom-funnel channels — branded search, retargeting, direct visits — that capture demand but rarely create it. Use last-touch alone and you'll eventually starve the brand and content investments that filled the pipeline in the first place.
About 41% of marketers still use last-touch exclusively. Don't be in that 41%.
This one matters. It's the model that gets ignored in every "attribution 101" article and it's the one that most often changes how you allocate paid budget.
Standard last-touch breaks on a specific pattern: paid ad → email → brand search → conversion. Last-touch credits the brand search. But the brand search is a navigation step — the prospect already knew who you were. The marketing that actually drove the journey was the paid ad and the email.
Last-Touch (Advanced) skips any touchpoint where the medium or source is organic — including untagged traffic, brand searches, and direct URL entries. So in our example: the paid ad ran, the email ran, then the prospect googled your brand name and bought. Standard last-touch gives organic search the $100. Last-Touch (Advanced) gives the email the $100, because that was the last non-organic marketing touch.
If you're running paid acquisition and looking at one model to gauge real ad efficiency, this is the one. It aligns with how Google Ads and Meta Ads report their own conversions, and it stops your owned channels from absorbing credit that belongs to your paid campaigns. In GrowthOptix, it's the default we recommend pairing with your ROAS calculator work.
Sidenote. Last-Touch (Advanced) is genuinely the one rule-based refinement worth its weight. If you only ever switch between two models for paid-channel analysis, switch between this one and First-Touch.
Linear splits credit equally across every touchpoint. Four touches in the journey? Each one gets 25%. Twelve touches? Each gets 8.3%.
It's the most "honest" multi-touch model in the sense that it doesn't impose any opinion about which touchpoint mattered more. That's also its weakness: a banner impression from month one gets the same weight as the demo two days before purchase. That's almost certainly wrong.
But for long sales cycles where you genuinely don't know which touchpoint mattered, linear is a defensible starting point. It's also the easiest model to explain to a CFO who doesn't trust the more opinionated weightings.
U-shaped gives 40% credit to the first touch, 40% to the last touch, and splits the remaining 20% across everything in the middle. The logic is that the touch that introduced the prospect and the touch that closed the prospect both did disproportionate work.
This is a reasonable opinion. It's not based on your data, though. The 40/40/20 split is an industry convention, not a finding from your conversion paths. Treat it as a useful default, not a derived truth.
U-shaped works best when your journey is short enough that "first" and "last" are still meaningful — typically under 90 days. For an eight-month enterprise sales cycle, the prospect's first touch was a podcast they don't even remember, and the U-shape is meaningless.
Time decay weights touchpoints by recency. Touches closer to conversion get more credit, touches further back get less. The decay curve is configurable.
Use this for shorter B2B journeys (think SMB SaaS, self-serve products) where the touchpoints right before conversion are genuinely doing more persuasion. For long enterprise journeys, time decay can completely erase the months of brand-building that made the close possible.
Google's data-driven attribution model uses machine learning to compute credit weights from your actual conversion paths instead of applying a fixed rule. Markov-chain attribution and Shapley-value attribution do similar things with different math. They sound great in conference talks. They're harder than they look in production.
Three problems show up in B2B SaaS specifically:
They're black boxes. You can't explain to your CFO why Channel A got 17% credit and Channel B got 11%. You can't audit the result. When a peer challenges the number, "the model decided" isn't an answer that holds.
They need volume. Most algorithmic models need hundreds of conversions per channel per month to learn anything stable. If you have 30 enterprise conversions a month, the output is essentially random — and worse, it'll look authoritative because it's a number, not a rule.
They overstate impact. Gordon et al. (2019) at Northwestern compared observational attribution methods (including data-driven approaches) to randomized incrementality experiments. Observational methods overestimated ad effectiveness by roughly 3x. Three times too generous, on average.
The honest take: data-driven attribution can work if you're a high-volume DTC brand or a self-serve SaaS doing thousands of conversions a month. For everyone else in B2B SaaS, rule-based models with a clear failure mode beat algorithmic models with an opaque one. The rule is the rule, and you can argue with it. A black box you can't audit will fool you eventually.
Here's the part most attribution articles skip: every model above tells the same dataset a different story, and that's a feature, not a bug.
The same conversions under First-Touch can tell you LinkedIn drove your funnel, while under Last-Touch (Advanced) they'll tell you email closed the deals. Those aren't contradictions — they're complementary truths about different parts of the same journey. The mistake is committing to one model and pretending the others don't exist.
The practical version: pick two defaults and look at both regularly. First-Touch for top-of-funnel awareness questions, Last-Touch (Advanced) for paid-channel ROAS questions. Don't switch models after you've seen the answer (that's how teams accidentally model-shop their way into defending whatever budget they wanted to defend in the first place). Pick ahead of time, look at both, and act on the convergence.
Most attribution tools force you to commit to one model and recompute history if you change your mind. The marketing attribution layer inside GrowthOptix calculates the standard rule-based models in parallel at the moment of conversion and stores all of them on the record, so switching views doesn't recompute anything — but the discipline of which model you trust for which question matters more than the tooling. Get the discipline right first.
Knowing how the data flows helps you see why your dashboards disagree. Three things matter most: the tracking layer, the identity layer, and the window.
GrowthOptix uses a first-party JavaScript tag — what we call the Tracking Script — installed on your own site. Because it runs on your domain, it isn't affected the same way third-party pixels are by Safari's Intelligent Tracking Prevention or by ad-blocker extensions.
Compare that to Facebook Pixel, Google Tag, and LinkedIn Insight Tag. Those are third-party tags. Roughly 15-30% of users run ad blockers. Safari and Firefox block third-party cookies by default. That's a meaningful chunk of activity that goes missing before a model ever sees it.
We're honest about the limits in our own help docs: clearing cookies or switching devices may affect attribution. No first-party JavaScript fixes that. Anyone who claims "100% accurate cookieless cross-device tracking" is selling you something.
Your prospects don't stay on one device. They research on mobile during their commute, continue on a laptop at the office, and convert from home. Without identity resolution, that's three separate users in your data.
There are two ways to connect them:
Most B2B journeys involve a long anonymous research phase before anyone signs up. During that phase, deterministic matching can't help. Which means a meaningful portion of every B2B journey is just unrecoverable. Build that assumption into your decisions.
Attribution windows determine how far back you look for touchpoints. Short window → you miss the early funnel. Long window → you catch noise.
Here's the B2B problem: average B2B journey is 211 days. Google Analytics limits Google Click ID tracking to 90 days. GA4 retains user-level data for two months by default — extendable to 14 months on free accounts, which is still less than many enterprise sales cycles.
GrowthOptix uses session-and-event-based attribution rather than fixed time windows. In plain English: attribution is based on session and event context captured by the Tracking Script. How long attribution data is preserved and how events are associated with visits depends on configuration.
If your sales cycle is six months, you need to verify your attribution window matches it. Otherwise the first three months of every journey are invisible to your dashboard.
Google, Meta, LinkedIn, Amazon, and TikTok control roughly 65% of digital ad spend. They don't share user-level data with each other. They each use their own attribution models. And — surprise — those models tend to favor their own platforms.
The result: every platform claims credit for the same conversions. Add up the numbers and you'll find you "drove" 250% of your actual revenue. One documented case showed Facebook reporting £450k in revenue while Google Analytics showed £20k. Actual revenue was around £250k.
Eighty percent of marketers say they're concerned about ad-platform reporting bias. They're right to be.
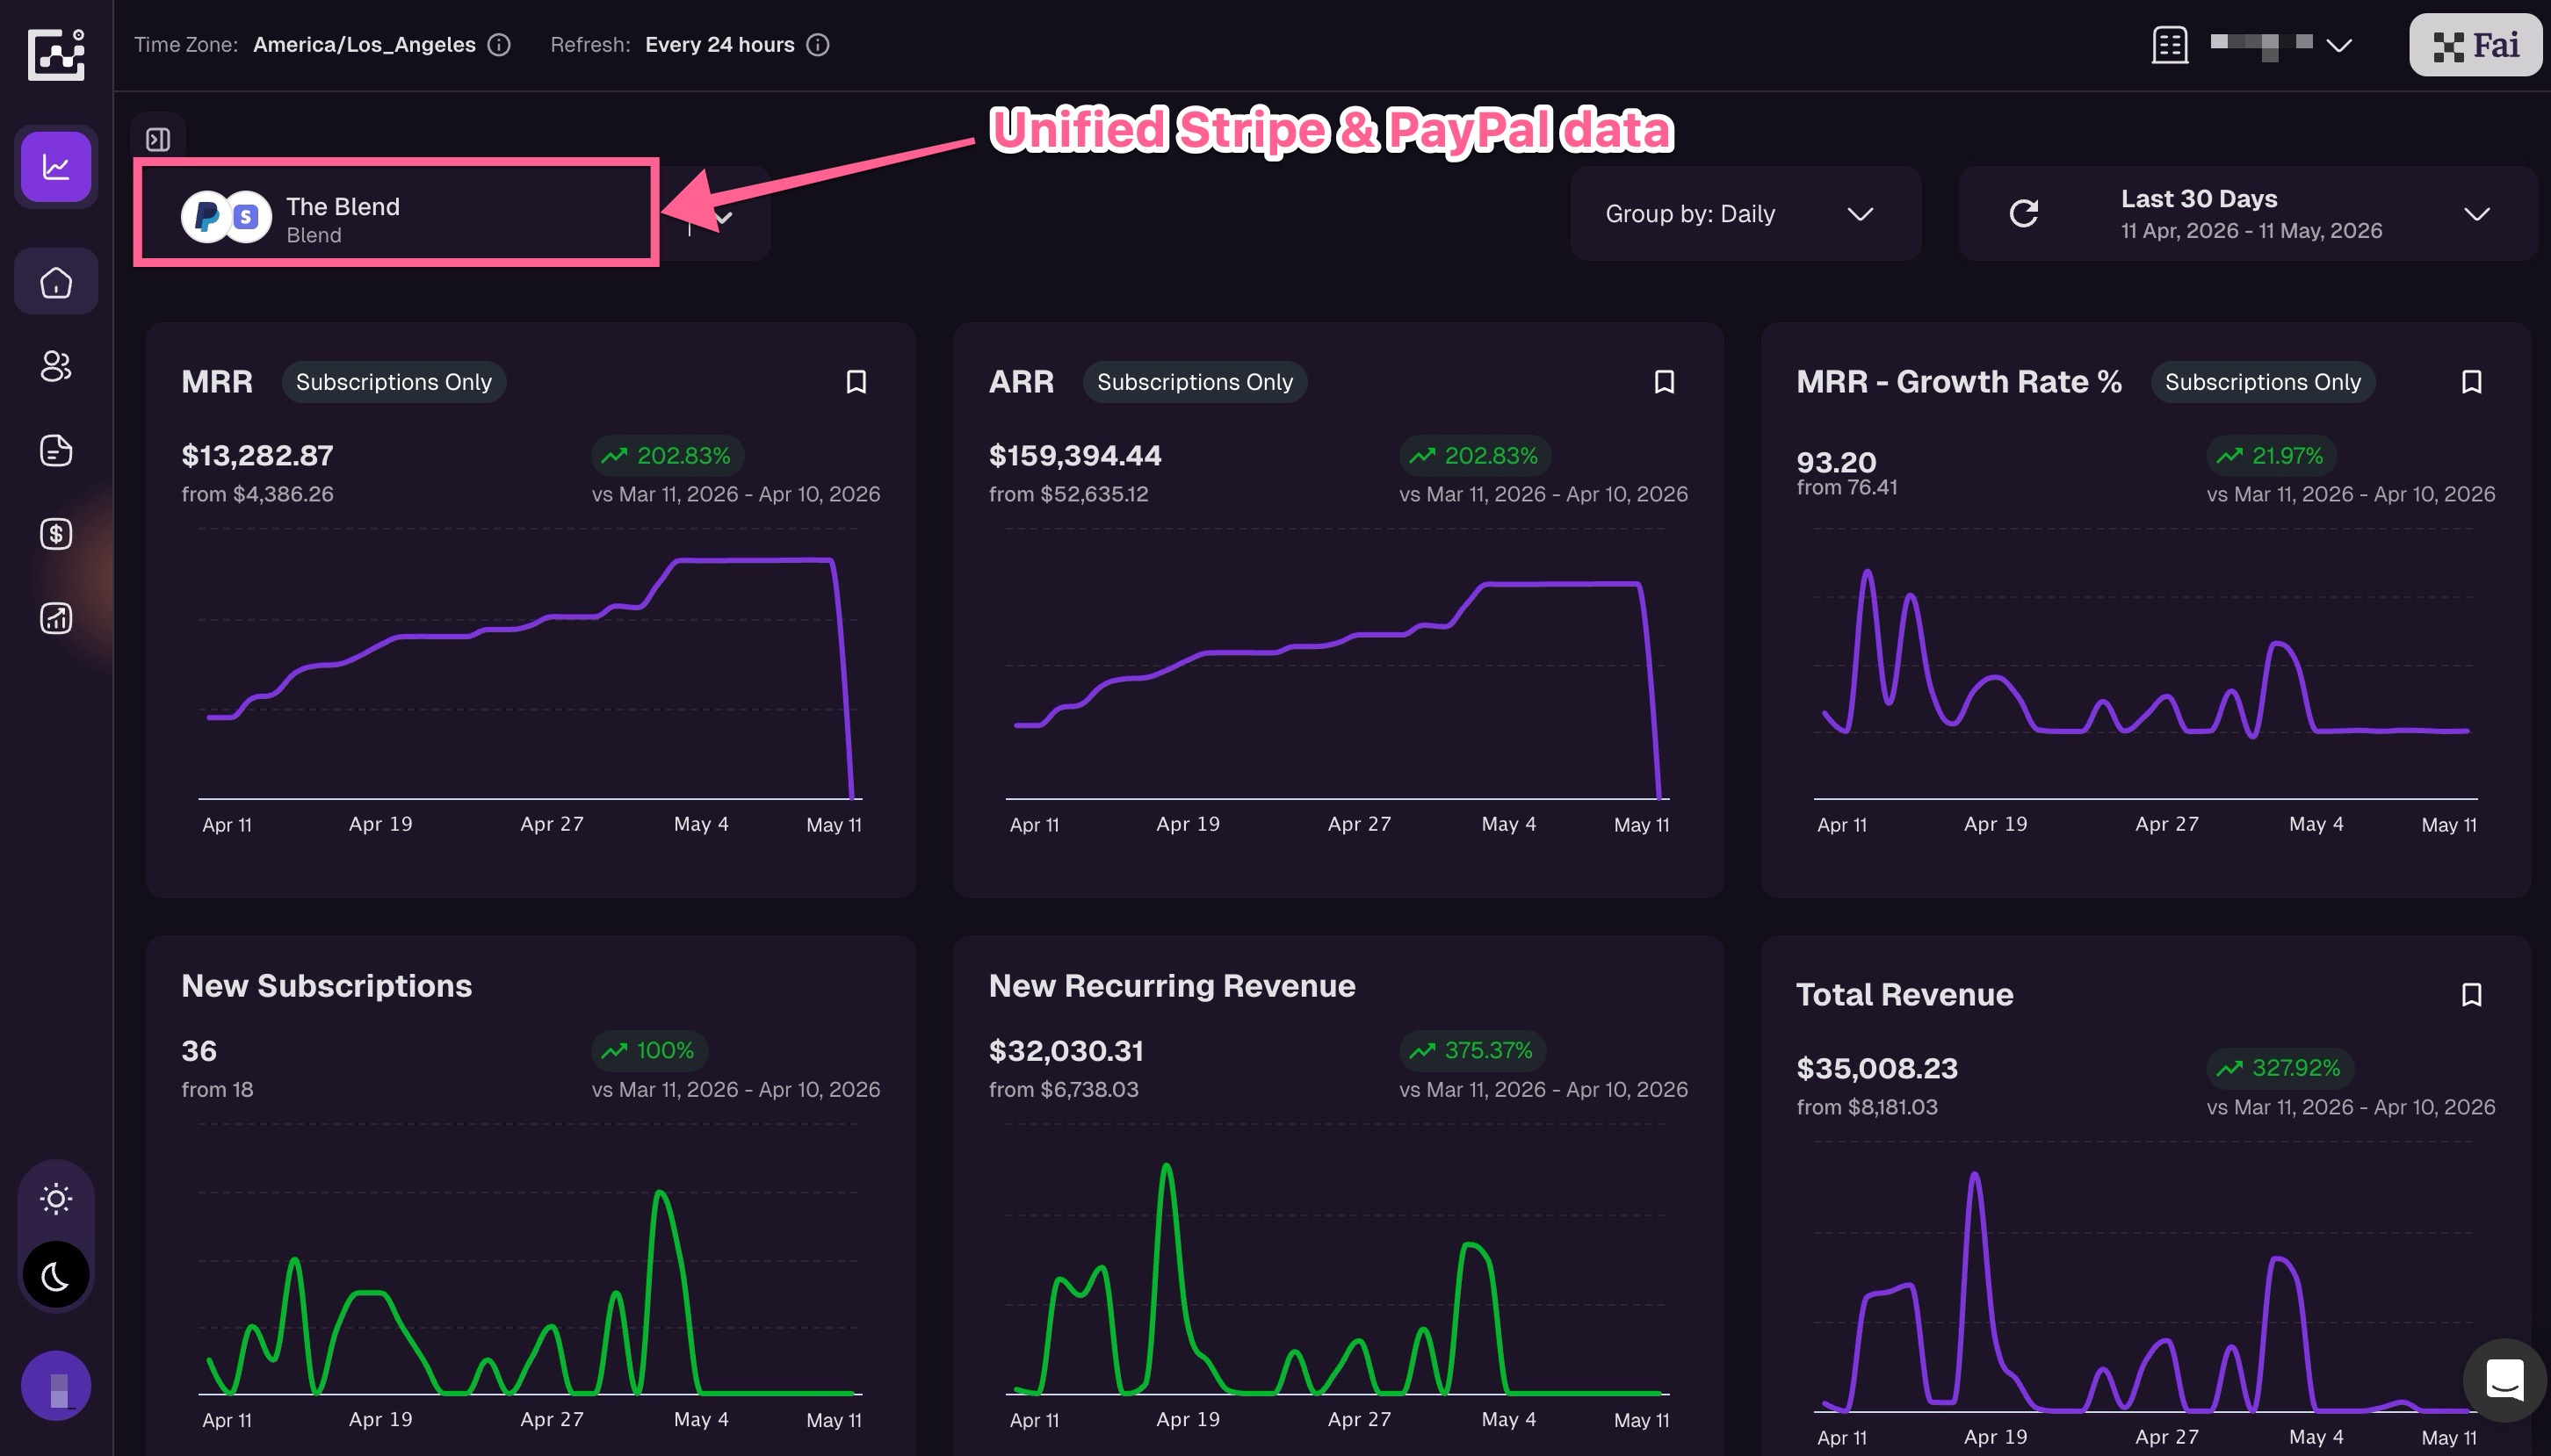
The only way out: have one source of truth for revenue. In GrowthOptix, that source is your Stripe and PayPal data, blended together in the Blend and tied back to the touchpoints captured by the Tracking Script. Your ad platforms can claim whatever they want — your dashboard will know what actually closed.
Here's the part that should make every marketer humble: a lot of the activity that drives B2B purchases is unmeasurable in principle, not just in practice.
6sense's 2025 Buyer Experience Report found that B2B buyers delay contact until two-thirds of the way through their journey, and initiate outreach themselves over 80% of the time. Where does that earlier research happen?
None of this shows up in any attribution dashboard. Over 80% of deals show up as "direct traffic" or "unknown" source in analytics. Prospects often arrive at their first sales call already knowing your competitive differentiators — from research you'll never see in any dashboard, including ours.
This isn't a tool problem. It's a structural one. The fix isn't a fancier model. It's adding a self-reported attribution input — a "How did you hear about us?" question on high-intent forms — and feeding that data into your decisions alongside what your tracking captures.
Here's the framework that works in B2B SaaS. We call it The Triangulation Stack, and it's not original — variants of it have been built by practitioners at Funnel, Dreamdata, AppsFlyer, and serious in-house teams who got tired of single-method marketing measurement failing them. We're just naming it.
The Triangulation Stack has four legs, and you need at least three of them in some form:
1. Multi-touch attribution (MTA). What touchpoints showed up in winning journeys? This is the day-to-day optimization layer. It's what GrowthOptix does — rule-based attribution models on digital touchpoints tied to Stripe and PayPal revenue.
2. Marketing Mix Modeling (MMM). What aggregate channel spend correlates with revenue when you account for seasonality and external factors? MMM uses statistical regression on aggregated data, doesn't track individuals, and works with offline channels (TV, podcast, OOH). Google's open-source Meridian and Meta's Robyn are both free starting points.
3. Incrementality testing. What revenue would I have gotten anyway without this channel? This is the only method that actually measures causation. Geo-holdouts, audience holdouts, ghost ads — all variants. Slow (2-4 weeks per test), expensive in opportunity cost, but it's the closest thing to truth we have.
4. Self-reported attribution. What did the customer say convinced them? A single open-ended "How did you hear about us?" field on a high-intent form. Free-text, not a dropdown. Multiple studies show it doesn't hurt conversion rates and it captures dark-funnel sources nothing else can see.
Now here's the honest version: GrowthOptix is one of those four legs. We do MTA. We don't do MMM, and we don't do incrementality testing. If your business is mature enough to need all three, you'll need other tools alongside us — Meridian or Robyn for MMM, your own experiment design (or a vendor like Recast) for incrementality. The self-reported question goes in your sign-up form regardless.
What we do that the MTA leg of most stacks doesn't: tie touchpoints all the way through to MRR, retention, expansion, and churn. Most attribution tools stop at "lead created." We track which channels brought the customers who actually stayed and grew. Different question, different answer.
Enough theory. Here's the setup for a B2B SaaS team that's going from "no real attribution" to "we know where to spend." This is concrete enough to do this week.
The most expensive attribution tool in the world won't save you from inconsistent UTMs. "facebook" vs "Facebook" vs "fb" will appear as three separate sources in every dashboard you own.
About 64% of companies have no documented UTM naming convention. Organizations without UTM governance lose an estimated 22% of their attribution data to inconsistencies.
Document a UTM tagging convention, enforce lowercase, audit quarterly. This is free and high-impact.
Sidenote. Don't add UTMs to internal links. UTMs on internal links start a new session and overwrite your original source. Some teams break their attribution this way for years before they notice.
Connect Stripe in GrowthOptix → connect PayPal in GrowthOptix → open the Blend. Your real revenue, in one place, before any marketing attribution layer even gets involved. This is the number every channel claim has to reconcile against.

If you're running on multiple processors and your "MRR" number is different in three different places right now, this is the first fix. Without one source of truth for revenue, attribution is arguing about percentages of a number that itself is wrong.
Drop the Tracking Script into your site's head section. It's a single first-party JavaScript snippet. Verify the install fires on the pages that matter — landing pages, pricing, sign-up.
In the Marketing Attribution dashboard, set Last-Touch (Advanced) as your default model for paid-channel ROAS analysis and First-Touch for top-of-funnel awareness analysis. You can switch models instantly, but having two defaults you've committed to in writing prevents model-shopping.
Add a single open-ended "How did you hear about us?" field to your high-intent forms — demo request, pricing request, paid sign-up. Free text, not a dropdown.
Review the answers monthly. The patterns you see in self-reported data — "a friend at [Company]," "the [podcast] interview," "a Slack community thread" — are your dark funnel becoming visible. None of this will ever show up in tracking. All of it influences pipeline.
Once you have weeks of attribution data, FAI — GrowthOptix's natural-language analysis layer — lets you ask the questions you'd otherwise build five dashboards for. "Which paid channel brought customers with the highest LTV last quarter under Last-Touch (Advanced)?" gets answered in a sentence, not a Looker explore.
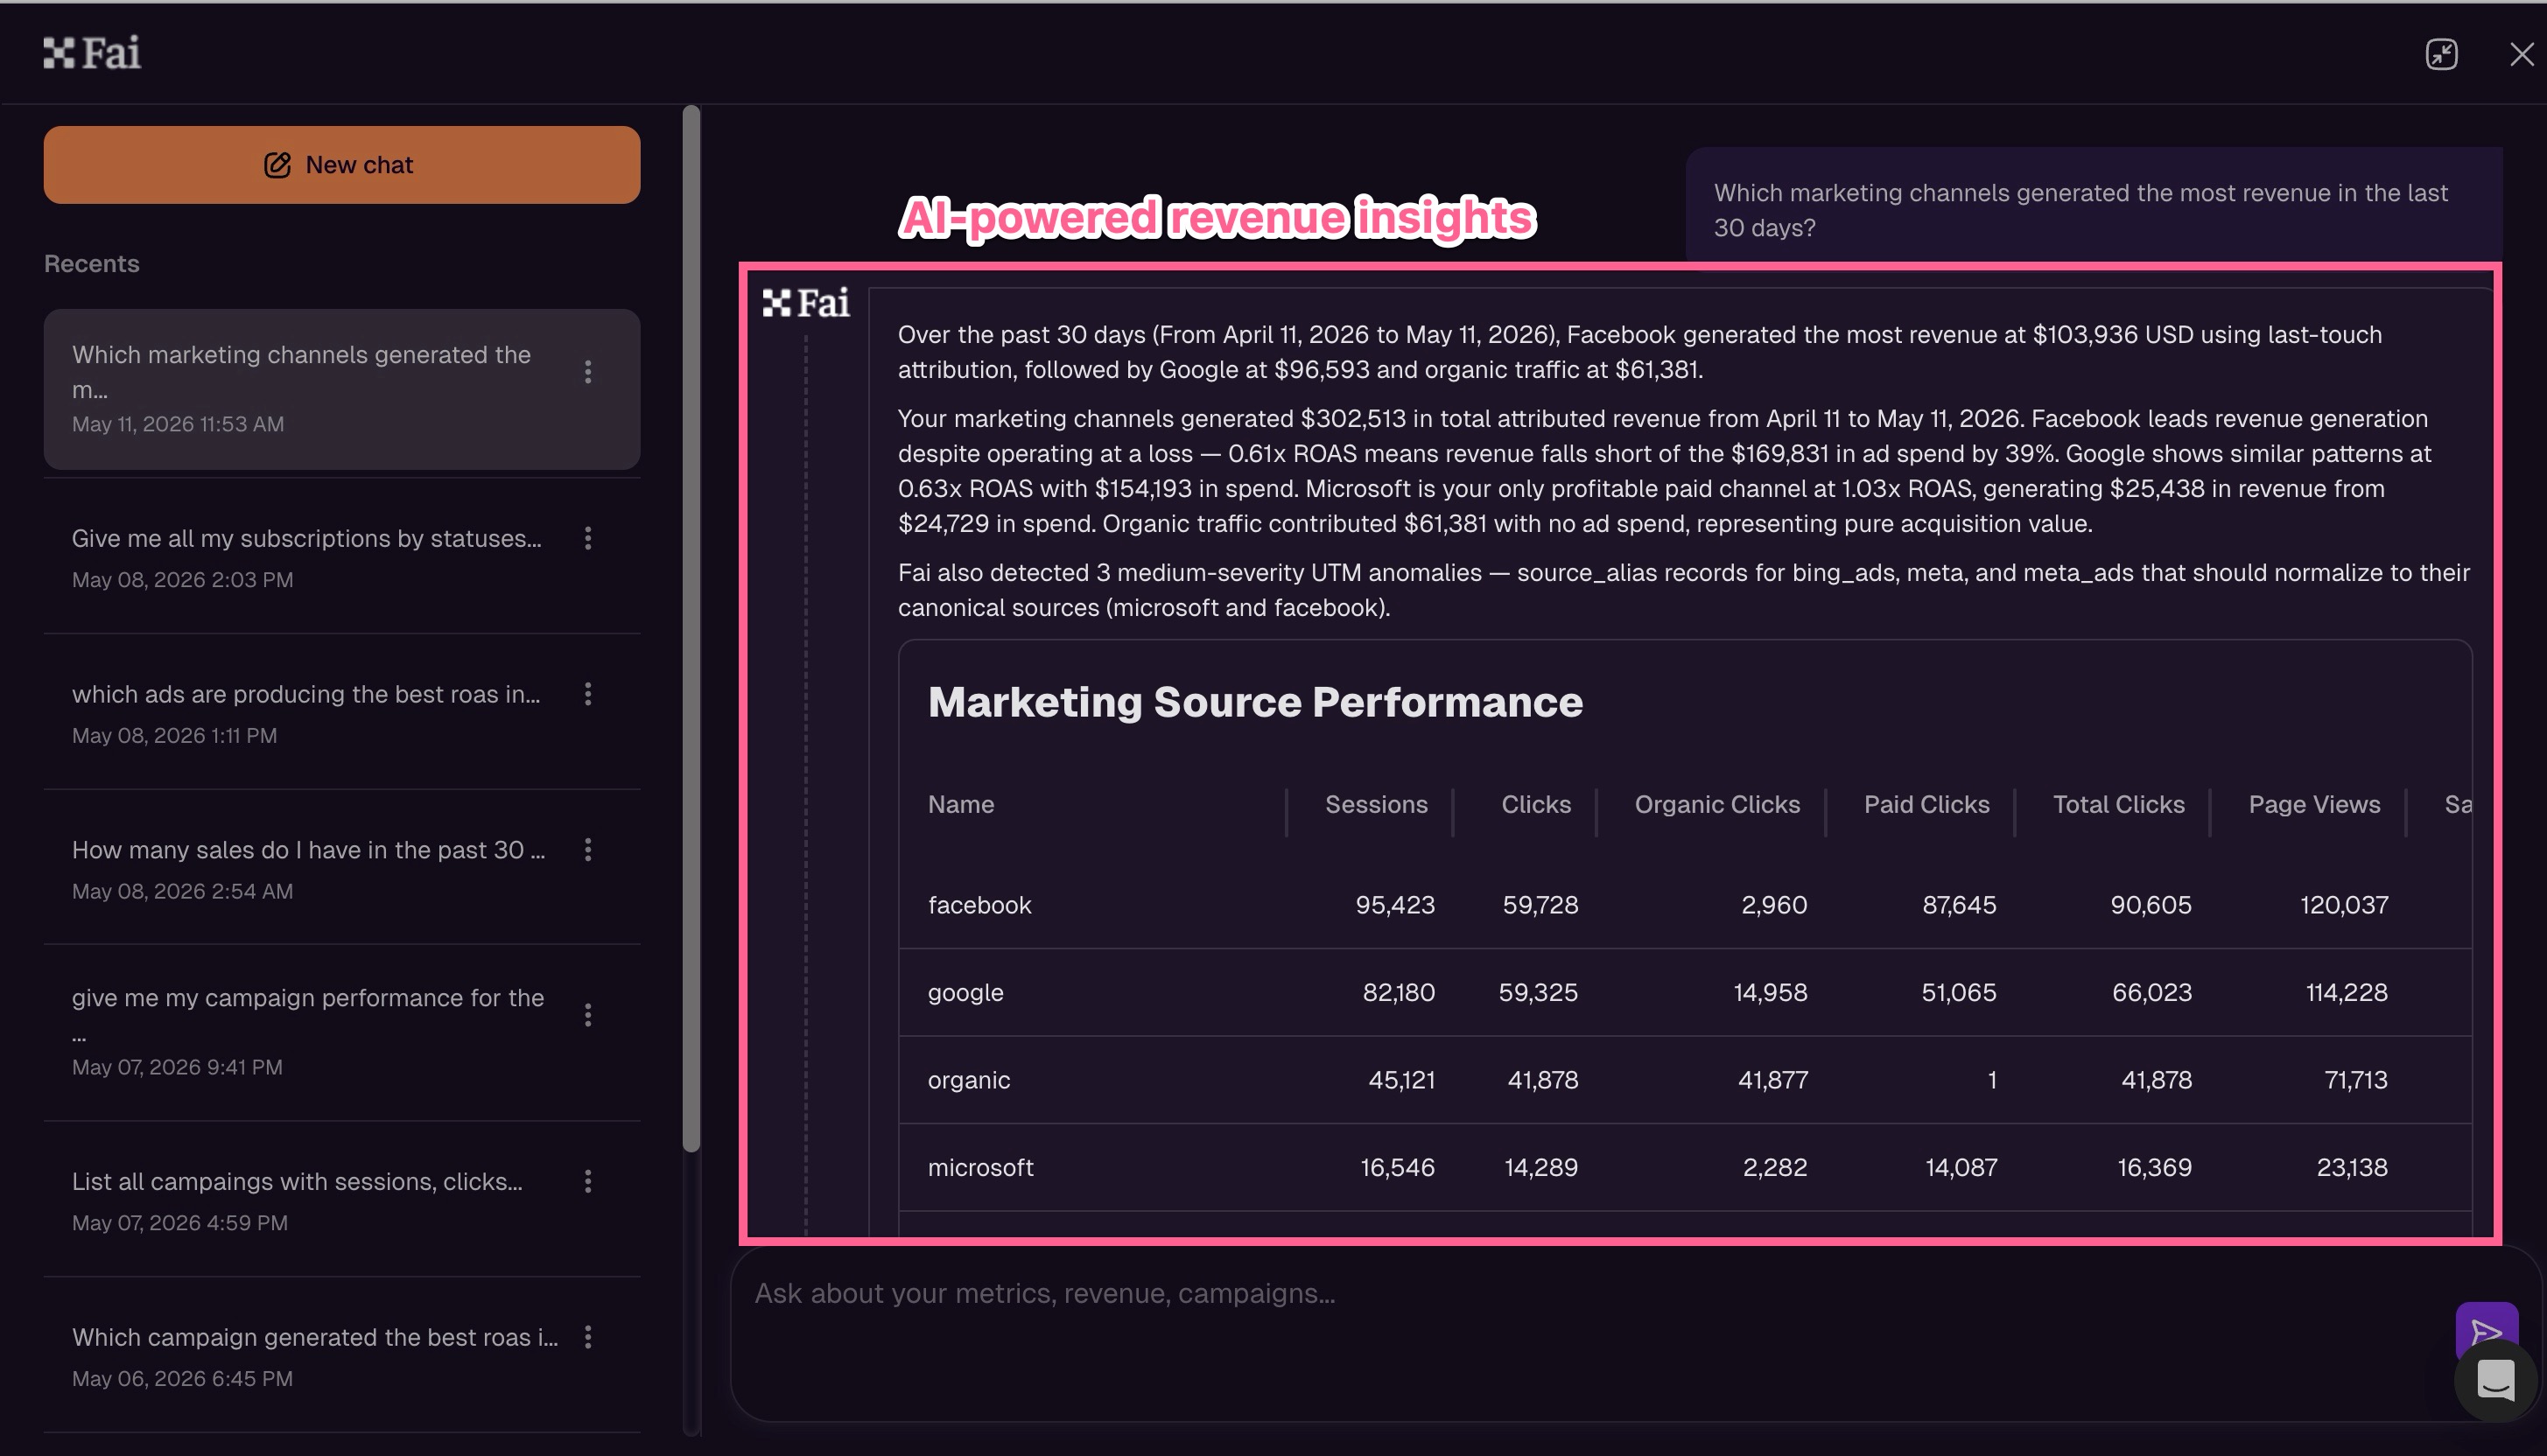
FAI doesn't assign attribution credit — the underlying models do that. FAI sits on top and lets you query the result conversationally. It's the difference between owning the data and being able to actually use it on a Tuesday afternoon when you have a budget review at 4pm.
Most metrics in this article have a free GrowthOptix calculator. If you just need to ballpark a number for a meeting, the calculators are the fastest path:
The free calculators give you one number from numbers you type in. The Marketing Attribution dashboard, the Blend, and FAI give you those numbers — automatically, for every channel, every cohort, every month — pulled live from your Stripe and PayPal data.
If you're allocating budget across two channels and you need a directional answer this week, use the calculators. If you're going to be running this analysis every month, run it inside GrowthOptix so it's always current and the rest of your finance team is looking at the same numbers.
No.
Here's where the simple version of the framework breaks down, and you should know.
Volume matters more than model sophistication. If you have 30 paid conversions a month, no attribution model will tell you anything reliable. You'll see massive variance week to week and mistake it for signal. Below ~100 conversions per channel per month, prefer simpler models (First-Touch, Last-Touch Advanced) and don't overinterpret the results.
Brand spend will always look bad in attribution. Brand-building creates demand months before any tracking pixel sees it. 95% of your potential buyers aren't in-market today. If you cut brand spend because last-touch attribution says it doesn't perform, you'll eventually starve your pipeline. This is the single most expensive mistake we see B2B SaaS marketers make with paid ads. Don't make it.
Attribution insights threaten budgets. Channel owners defend their numbers. Different teams get evaluated on different metrics. When you try to reallocate budget based on attribution, you're not just making a financial decision — you're making a political one. Only 23% of marketers strongly agree that attribution actually influences their budget decisions. The technical part is often easier than the people part.
Reach for triangulation, not certainty. Don't wait for a single model that gives you the right answer. It doesn't exist. Make decisions with 80% confidence using the Triangulation Stack and iterate. The companies that get the most from attribution aren't the ones with the best model — they're the ones who decided faster and learned faster.
One honest limitation we'll repeat. GrowthOptix is purpose-built for subscription-revenue attribution and SaaS metrics. If you need product analytics on event-level user behavior — feature usage, in-app funnels, session replays — pair us with Mixpanel, Amplitude, or PostHog. Attribution and product analytics are different problems with different tools.
Marketing attribution won't be solved. Privacy regulations will keep shifting. Platforms will keep changing their rules. B2B journeys will keep getting more complex.
The companies winning at this aren't waiting for perfect measurement. They run two or three rule-based MTA models alongside each other, layer in self-reported attribution, run an incrementality test once a quarter, and revisit the picture every month with one source of truth for revenue underneath.
Start where you are. Fix your UTMs. Connect Stripe and PayPal in the Blend. Install the Tracking Script. Add the "How did you hear about us?" field. Pick your two default models and stick with them.
Join hundreds of SaaS companies who finally understand which marketing drives profitable growth.