November 25, 2025
The Only SaaS Metrics Guide You Need in 2025 (Why Most Founders Track the Wrong Numbers)
Written by
Content Marketing Manager

November 25, 2025
Most founders and marketing leaders track the wrong things.
You're drowning in dashboards with 50+ metrics, celebrating vanity numbers like "total registered users" while your burn rate screams and customer churn quietly kills your business. Companies that win focus on maybe 7-10 metrics that actually predict revenue and survival.
The game changed between 2023-2025. What worked during the zero-interest-rate era evaporated overnight. Growth rates dropped, investors stopped funding unprofitable growth, and companies had to prove efficiency. Private B2B SaaS companies saw median growth fall to 19-21% while operating margins improved from -26% to -6% between 2022-2024.
This guide cuts through the noise. Whether you're a founder trying to understand what investors care about, a VP of Marketing defending your budget, a growth marketer optimizing funnels, or a CMO building board presentations, you'll learn which metrics matter at your stage, how to calculate them correctly, and what actions to take when numbers go sideways.
Traditional B2B sales metrics were built for one-time transactions. You sell a widget, collect payment, done. Success means closing deals and hitting quarterly targets.
SaaS destroyed this model completely.
When you sell subscriptions, the initial sale is just the beginning. A customer paying $10,000 upfront for annual software matters far less than whether they'll still be paying you $10,000 next year, and ideally $15,000 the year after through expansion. The economics flip entirely.
This creates a fundamental measurement problem. Your VP of Sales celebrates closing 20 new customers this month while quietly, 18 existing customers churned. Net result? You actually lost customers. Traditional sales metrics would show this as a "winning" month because new bookings look healthy.
Think about it like this: Your SaaS business is a leaky bucket. Traditional sales metrics measure how fast you're pouring water in. SaaS metrics measure both the pour rate AND the size of the holes.
Five critical differences break traditional approaches:
Recurring revenue changes everything. That $100K deal you closed? Traditional metrics count $100K in bookings. SaaS accounting recognizes $8,333 in Month 1, another $8,333 in Month 2, and so on. Revenue recognition spreads over the contract term.
Churn becomes existential. Lose 5% of customers monthly? Traditional business shrugs and sells more. SaaS business dies. That 5% compounds to 46% annual churn, which means you lose nearly half your customer base every year.
Expansion revenue dwarfs new sales. The best SaaS companies generate a significant portion of growth from existing customers buying more, not new customer acquisition. Your "account management" team isn't a cost center. They're your most efficient revenue engine.
Unit economics determine survival. Traditional businesses can be profitable per transaction immediately. SaaS companies burn cash for 12-24 months before recovering customer acquisition costs. If your Customer Acquisition Cost is $5,000 but customers generate only $4,000 in lifetime value, every sale accelerates your bankruptcy.
Leading indicators predict months ahead. Website traffic today impacts trials in 2 weeks, which convert to customers in 6 weeks, whose retention you'll measure in 6 months. Traditional sales tracks closed deals, which are lagging indicators of decisions made 60-180 days ago. SaaS demands leading indicators that show what's coming.
Forget the 50-metric dashboards. These seven metrics tell you whether your business will survive, thrive, or slowly die. Master these before getting fancy with advanced analytics.
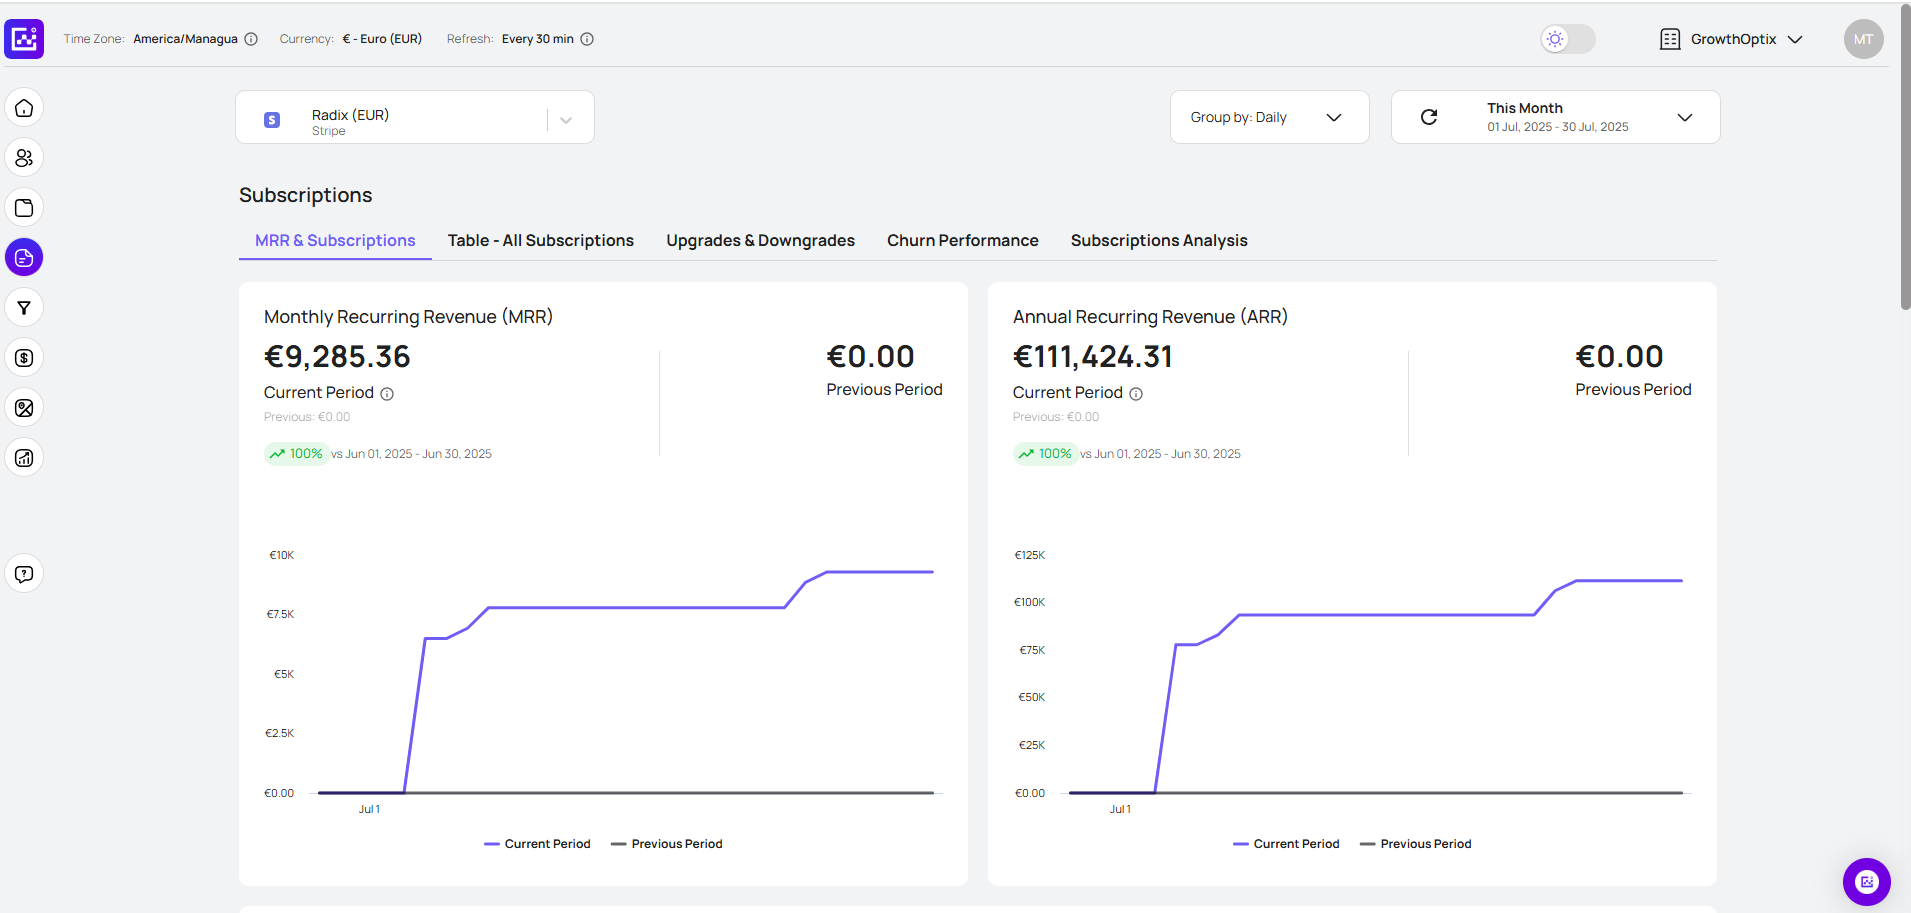
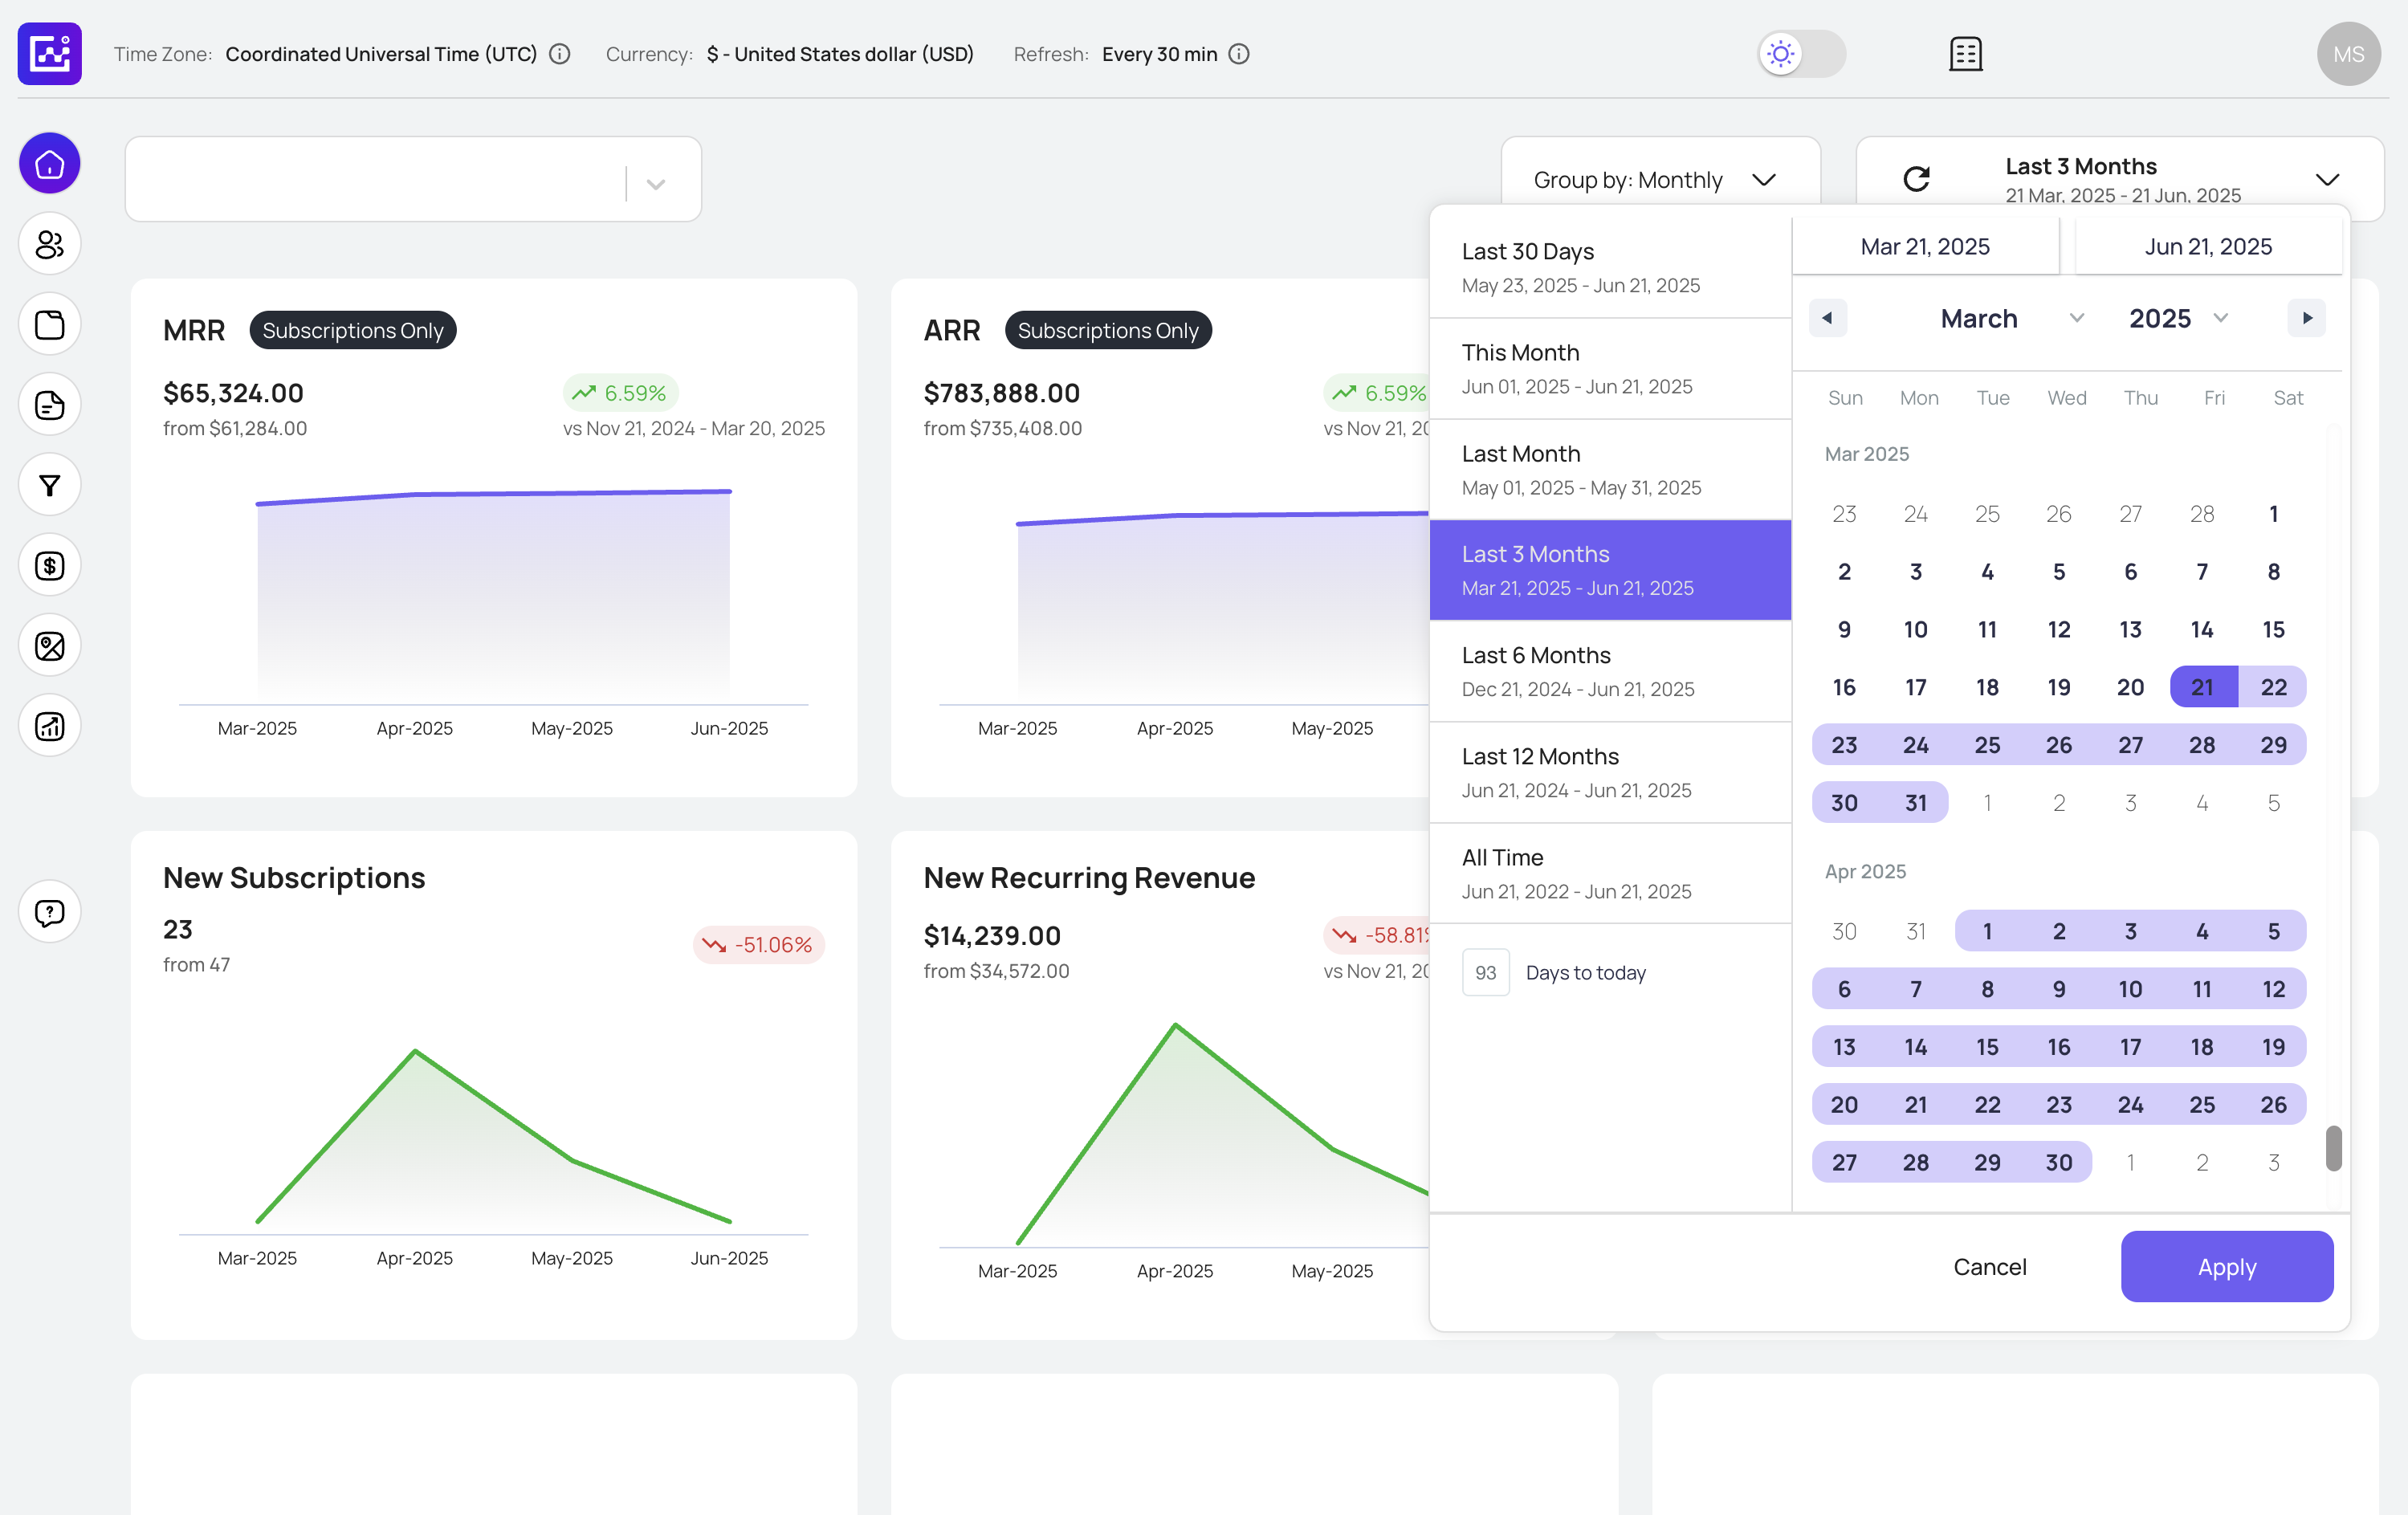
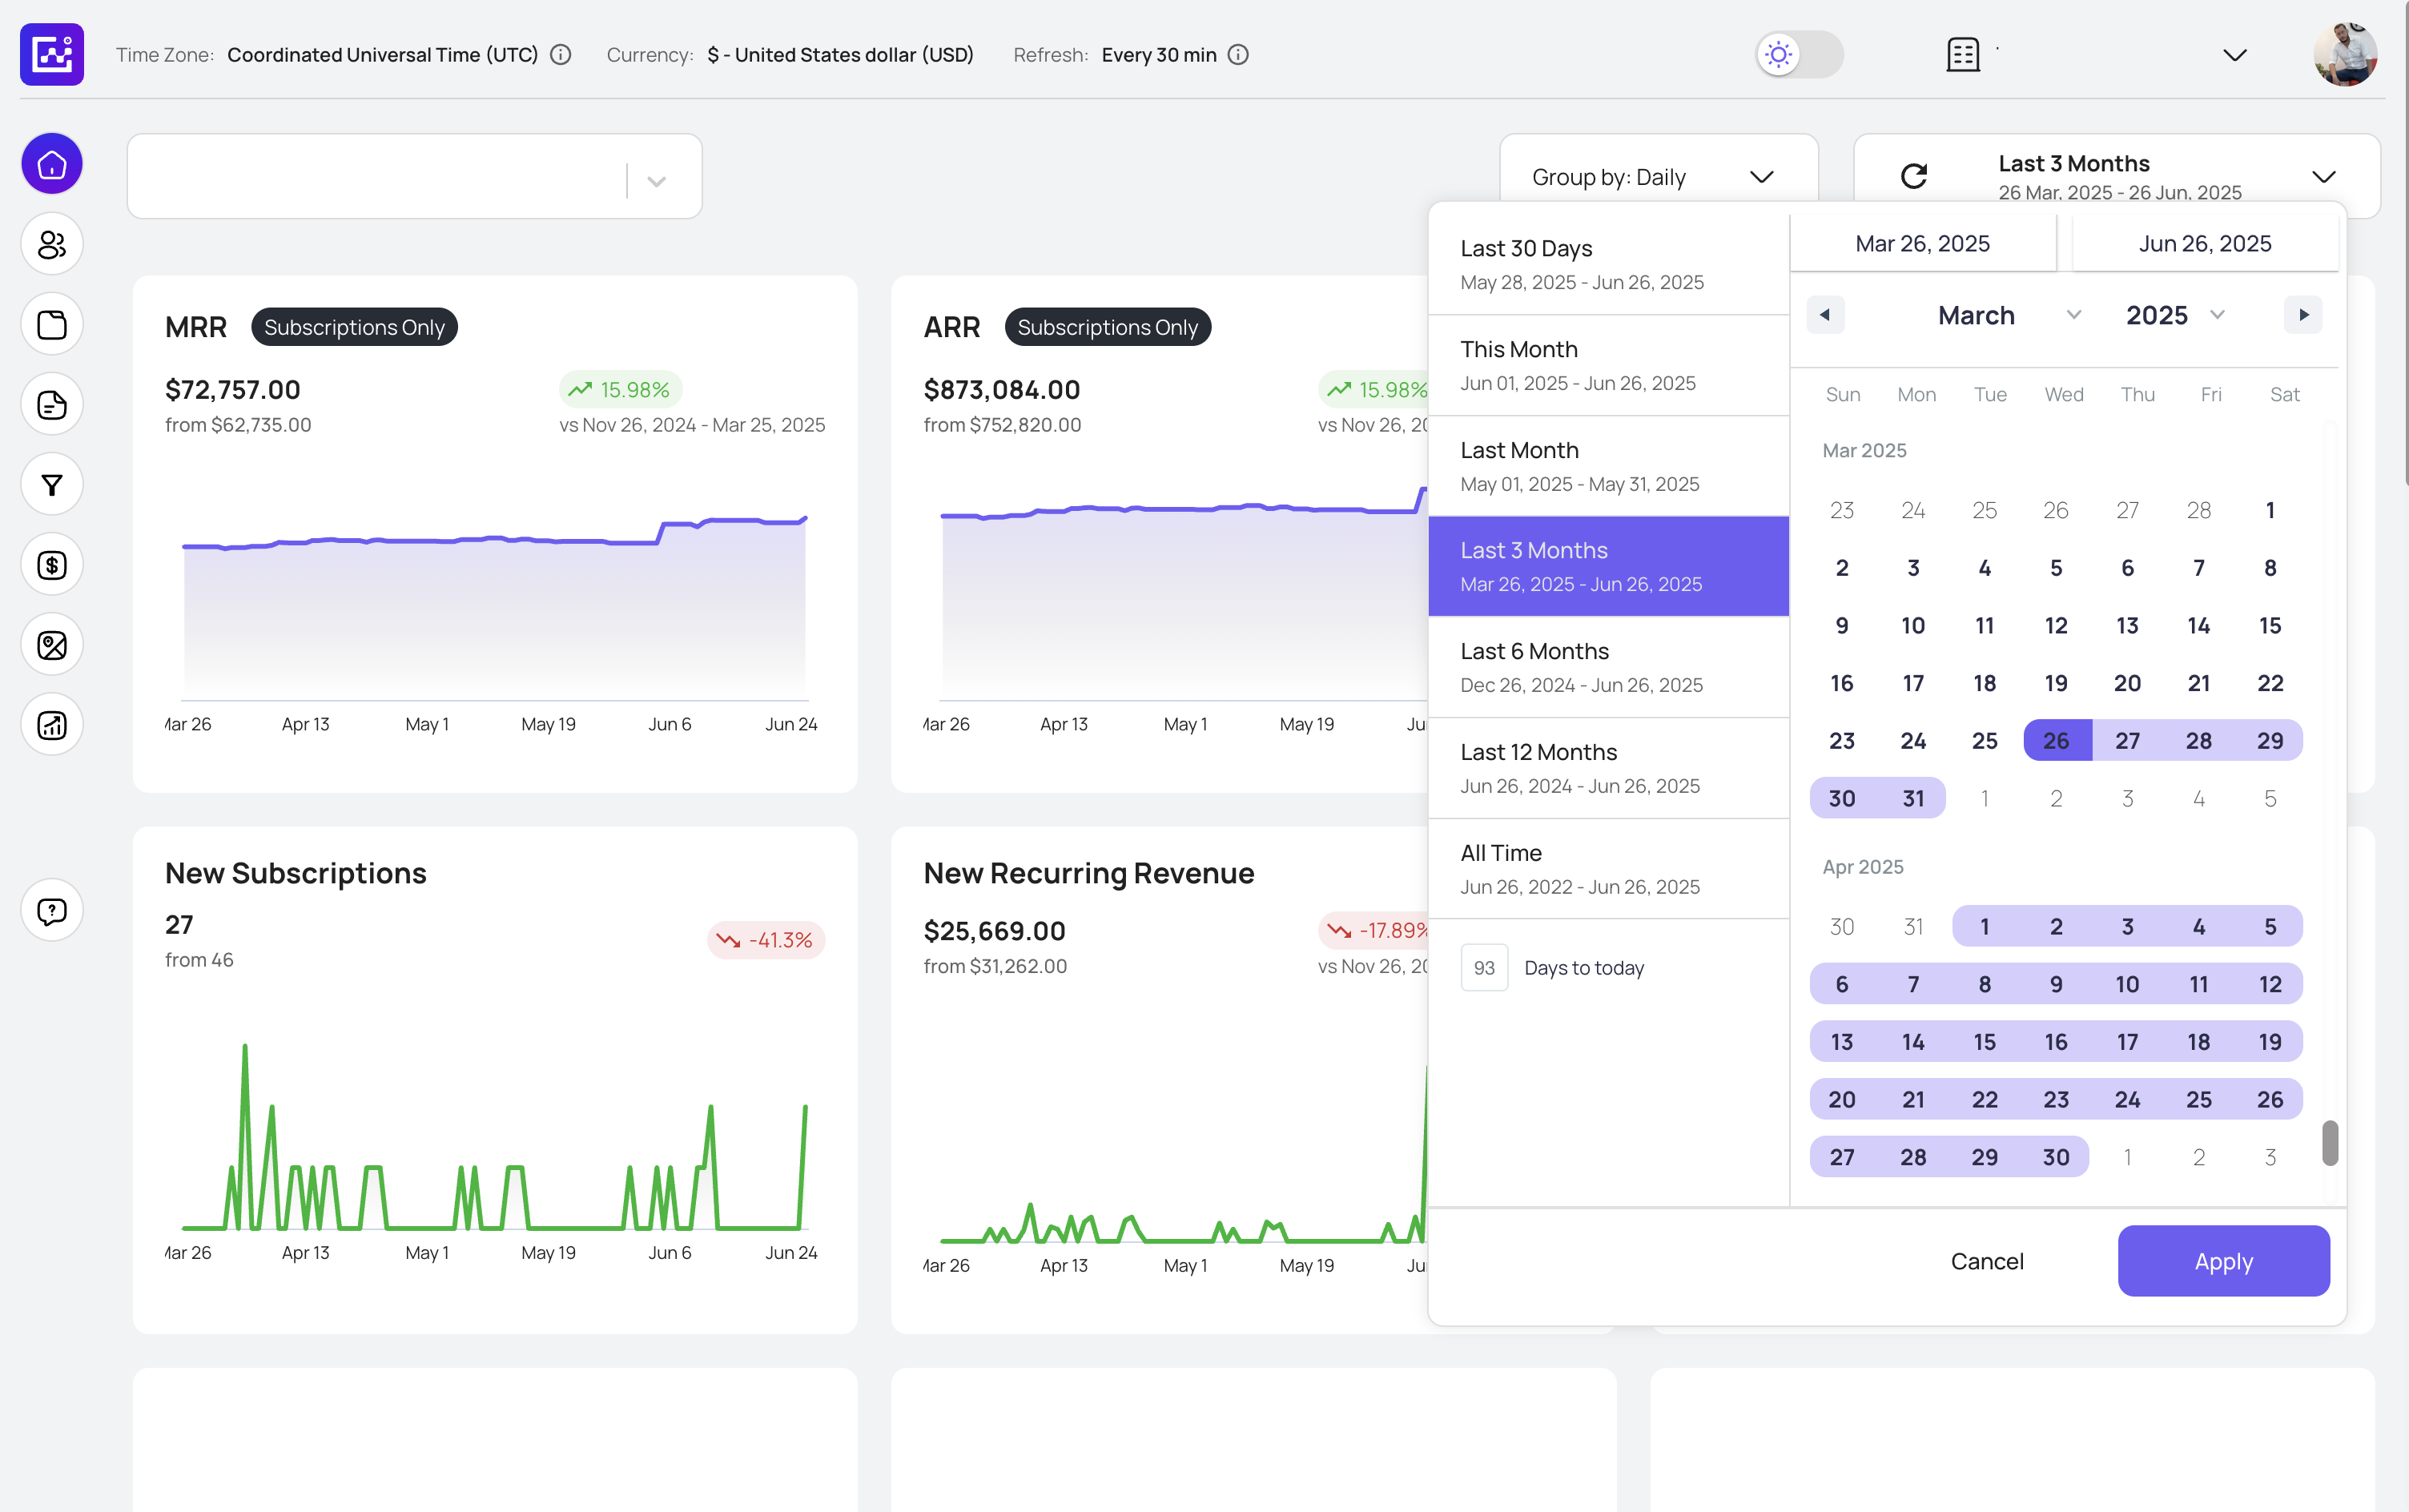
MRR is your business's heartbeat. It represents the normalized monthly subscription revenue from all active customers. ARR multiplies that by 12 to show your annual run rate.
Calculate it correctly:
Include only recurring revenue. Annual subscriptions get divided by 12. Multi-year contracts get divided by total months. Monthly subscriptions take the monthly amount. Exclude one-time setup fees, professional services revenue, and variable usage charges unless they're consistently recurring.
Don't double-count. If a customer on a $1,200 annual plan is 3 months in, your MRR is $100, not $1,200. You've already recognized $300 of that contract in prior months.
A concrete example: You have 100 customers paying $99/month, 20 customers on $1,200/year annual plans, and 5 enterprise customers at $5,000/month. Your MRR calculation:
The metric that actually matters isn't MRR itself. Net New MRR shows whether your business is growing or shrinking:
Net New MRR = New Customer MRR + Expansion MRR - Churned MRR - Contraction MRR
If you added 10 customers at $100/month ($1,000 new MRR), upsold existing customers by $500 total (expansion MRR), but lost 5 customers who were paying $100/month ($500 churned MRR) and 3 customers downgraded from $200 to $100/month ($300 contraction MRR):
Net New MRR = $1,000 + $500 - $500 - $300 = $700
That's your actual growth. Not the $1,000 in new customer revenue you're celebrating, but the $700 that survived the churn and contraction gauntlet.
If you're a founder pitching investors, they'll calculate your Net New MRR growth rate immediately. Below 10% monthly is concerning for early stage. If you're a CMO defending marketing spend, show how your campaigns drive new MRR, not just "pipeline value" that may never convert or may churn immediately. Growth marketers optimizing funnels need to understand that every improvement in activation and early retention protects MRR from landing in the contraction or churn buckets.
CAC answers the existential question: How much does it cost to acquire a customer?
The calculation seems simple but everyone screws it up. The right formula:
CAC = Fully-Loaded Sales & Marketing Expenses ÷ New Customers Acquired
"Fully-loaded" is where people cheat themselves. Include everything:
A realistic example for a $5M ARR company:
If you acquired 25 new customers that month: CAC = $235,000 ÷ 25 = $9,400
CAC alone is meaningless. Spending $10,000 to acquire a customer paying $100,000 annually? Great. Spending $10,000 to acquire a customer paying $500 annually? Bankruptcy speedrun.
That's where CAC Payback Period comes in. It shows how many months it takes to recover your acquisition cost:
CAC Payback Period = CAC ÷ (Monthly ARPA × Gross Margin %)
Using our example with $9,400 CAC, if Average Revenue Per Account is $400/month and your gross margin is 80%:
CAC Payback = $9,400 ÷ ($400 × 0.80) = $9,400 ÷ $320 = 29.4 months
That's terrible. According to industry analysis, most SaaS companies target payback under 12 months ideally, though 12-18 months is acceptable depending on segment and sales cycle. At 29 months, you're burning cash for nearly 2.5 years before breaking even on each customer. If monthly churn is 3%, there's a decent chance customers leave before you recover acquisition costs.
The critical benchmarks by segment:
Calculate CAC separately by customer segment and acquisition channel. Your paid search might have $3,000 CAC while product-led signups cost $200. Double down on efficient channels. If CAC Payback exceeds 18 months, stop scaling growth spend and fix unit economics first. VPs of Marketing should track CAC trends monthly. If it's creeping up, your targeting is getting sloppy or competition is intensifying.
LTV predicts how much total revenue you'll collect from an average customer before they churn. The simple formula:
LTV = ARPA ÷ Monthly Revenue Churn Rate
If your Average Revenue Per Account is $300/month and you lose 2% of revenue to churn monthly:
LTV = $300 ÷ 0.02 = $15,000
This massively understates value if you have expansion revenue. Use the cohort method instead. Track actual revenue from a specific group of customers over their lifetime. If customers acquired in January 2024 have generated $20,000 average revenue so far and historical data shows they'll generate another $15,000 before churning, your LTV is $35,000, not $15,000.
Always adjust for gross margin: True LTV = LTV × Gross Margin %
If your calculated LTV is $15,000 and gross margin is 80%, your actual economic value is $12,000. The other $3,000 goes to costs of goods sold (hosting, support, infrastructure).
LTV:CAC Ratio tells you whether your business model works:
Using our examples: LTV of $12,000 (gross margin adjusted) with CAC of $9,400 gives you: LTV:CAC = $12,000 ÷ $9,400 = 1.28:1
That's trouble. You're spending $9,400 to acquire a customer who only generates $12,000 in value. That's barely a 28% return after covering acquisition costs. Factor in operational costs, and you're losing money on customers.
Don't use gross revenue LTV without margin adjustment. A $20,000 LTV sounds impressive until you realize 40% goes to COGS, making true economic value only $12,000. That changes LTV:CAC from a healthy-looking 2.1:1 to a concerning 1.28:1.
Founders should know that investors will calculate your LTV:CAC immediately. Below 3:1? Expect tough questions about unit economics and path to profitability. CMOs can justify increased marketing spend with confidence if LTV:CAC is healthy (3:1+). Growth marketers should focus obsessively on retention and expansion. Every 1% improvement in churn dramatically increases LTV without increasing CAC.
If you could track only one metric, make it Net Revenue Retention. Companies with strong NRR earn significant valuation premiums because they prove customers stick around AND spend more over time.
NRR measures the revenue you retain and expand from a cohort of customers over a period, typically calculated annually:
NRR = (Starting ARR + Expansion ARR - Churned ARR - Contraction ARR) ÷ Starting ARR × 100
The critical rule: Use the same cohort of customers. Don't include new customers acquired during the period. That pollutes the measurement. You're measuring what happened to your existing customer base.
A concrete example:
NRR = ($1,000,000 + $150,000 - $80,000 - $20,000) ÷ $1,000,000 × 100 = 105%
If you had acquired exactly zero new customers this year, your revenue would have grown 5% purely from existing customers spending more and staying around. That's the power of NRR above 100%. Your revenue compounds without new customer acquisition.
The brutal reality of 2025 benchmarks:
The deceptive cousin metric: Gross Revenue Retention (GRR) measures NRR without expansion:
GRR = (Starting ARR - Churned ARR - Contraction ARR) ÷ Starting ARR × 100
Using our example: GRR = ($1,000,000 - $80,000 - $20,000) ÷ $1,000,000 × 100 = 90%
GRR reveals true product stickiness. If your NRR looks healthy at 110% but GRR is only 85%, you're masking terrible retention with aggressive expansion. That's unsustainable because you can't expand customers who've already churned. Healthy GRR typically runs 90-95% for B2B SaaS.
Founders raising Series B+ rounds will face relentless NRR scrutiny. VPs of Marketing should track how different acquisition channels perform on retention. Cheap leads that churn immediately destroy NRR. CMOs presenting to boards should show NRR trends over time (improving/stable/declining). These trends tell more about business health than any single quarter's bookings. Growth marketers can improve NRR through better onboarding (reducing early churn) and systematic expansion programs (seats, features, modules).
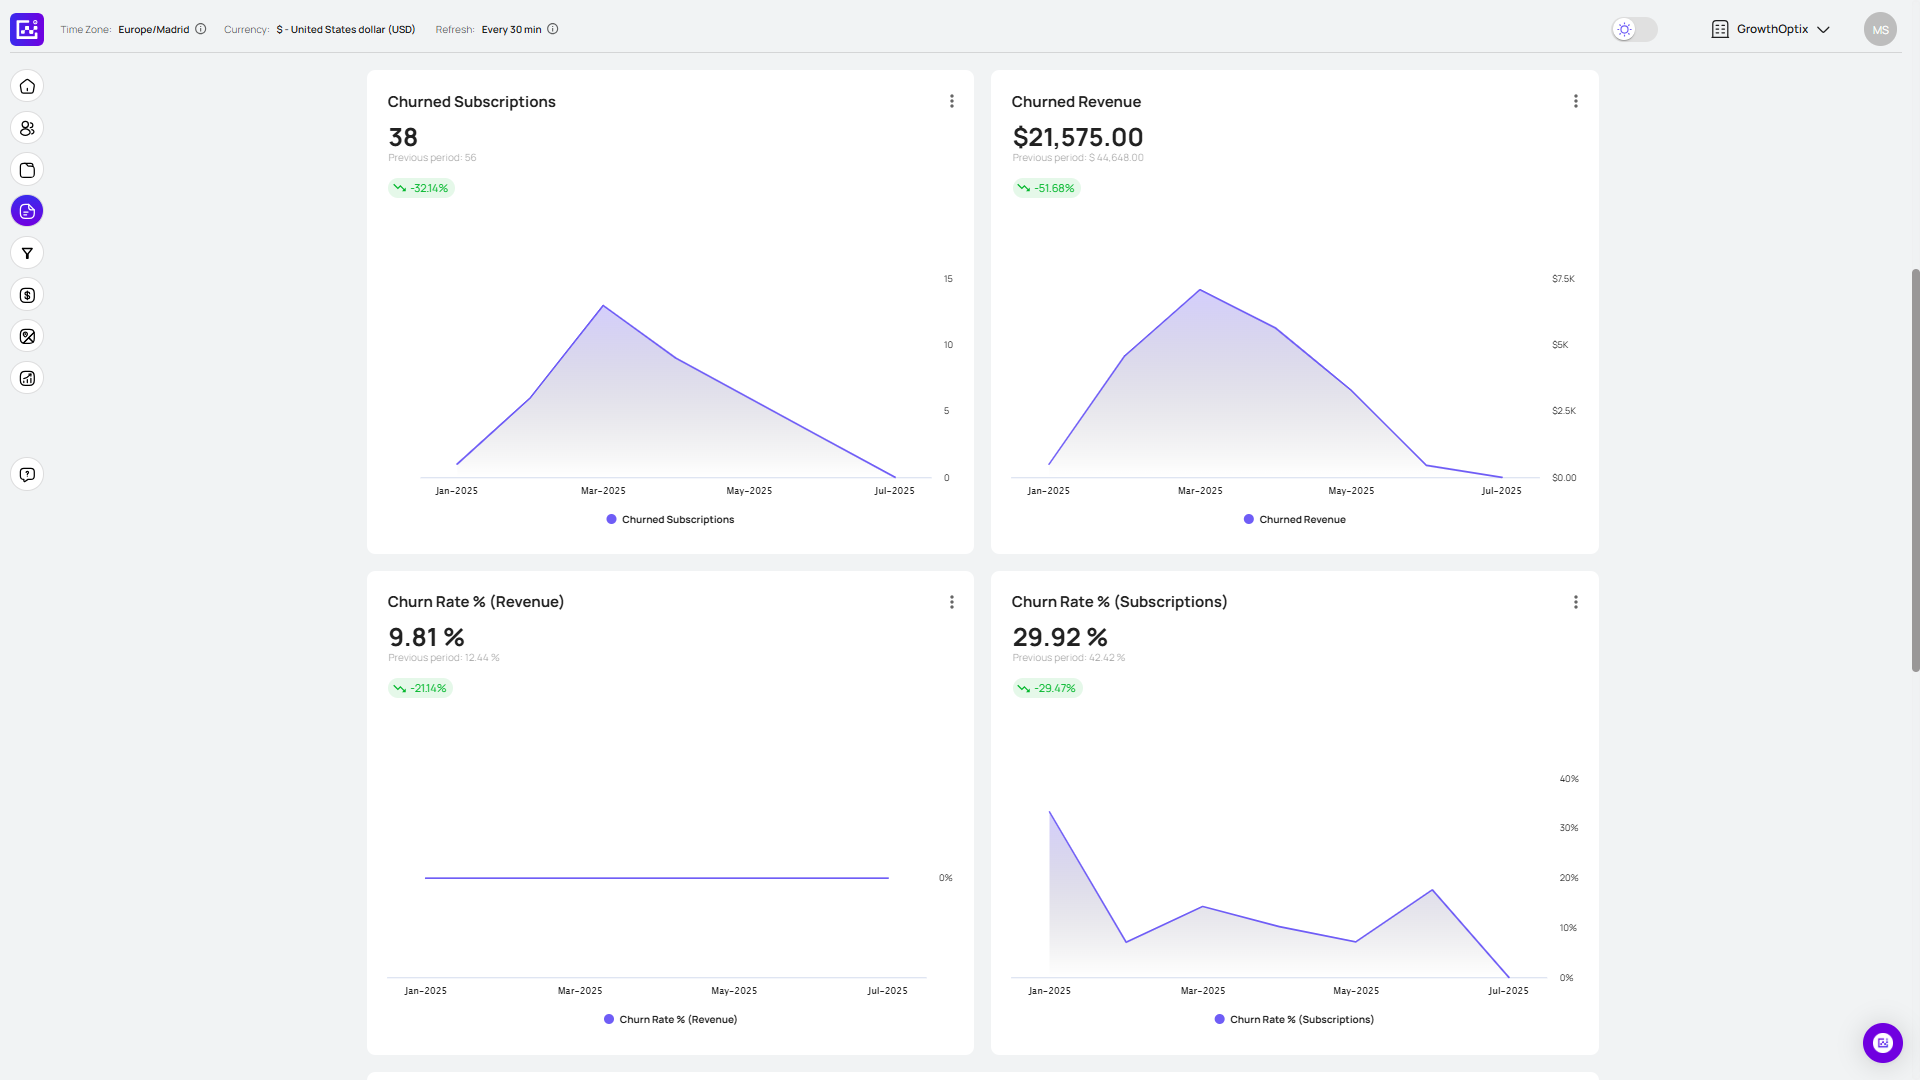
Churn measures how fast you're losing customers and revenue. These aren't the same metric, and confusing them causes expensive mistakes.
Customer Churn Rate (Logo Churn):
Monthly Customer Churn = Customers Lost in Month ÷ Customers at Start of Month × 100
If you started March with 400 customers and lost 12: Customer Churn = 12 ÷ 400 × 100 = 3% monthly
Sounds manageable? It's not. Monthly churn compounds brutally over time. That 3% monthly churn becomes 30.6% annual churn (not 36% due to compounding math). You're losing nearly a third of customers every year.
Revenue Churn Rate:
Monthly Revenue Churn = MRR Lost from Churn ÷ Starting MRR × 100
If you started March with $500,000 MRR and lost $15,000 from churned customers: Revenue Churn = $15,000 ÷ $500,000 × 100 = 3% monthly
Customer churn and revenue churn often differ dramatically. If your largest customers are churning, revenue churn will be worse than logo churn. If small customers are churning, revenue churn looks better than logo churn.
Example: You lose 10 customers (5% logo churn):
Those two large customers leaving destroyed your revenue churn metric. This is why revenue churn matters more than logo churn. It's weighted by value.
The acceptable benchmarks vary wildly by customer segment:
According to ChartMogul data analysis, median monthly churn sits around 4.1% for companies over $1M ARR, with top performers in the 1.3-1.5% range.
Track churn by cohort monthly. If customers acquired 12 months ago are churning at the same rate as customers acquired last month, you never achieved product-market fit. Healthy SaaS shows improving retention curves. Older cohorts churn less as they integrate the product deeper into workflows.
Interview every churned customer with actual conversations, not surveys. You'll discover patterns: customers who never completed onboarding churn fastest, customers who don't adopt feature X churn within 90 days, customers in industry Y have structural reasons for leaving. These insights let you intervene before churn happens.
Growth marketers should understand this: Your highest-ROI work isn't acquiring more leads. Reduce churn from 5% to 4%. That 1% improvement compounds into massive revenue gains.
The Magic Number measures how efficiently your sales and marketing spending converts into new revenue. Think of it as your S&M ROI.
Magic Number = (Current Quarter Net New ARR - Prior Quarter Net New ARR) × 4 ÷ Prior Quarter S&M Spend
The ×4 annualizes quarterly ARR growth to make it comparable to S&M spend.
A real example:
Magic Number = ($750,000 - $500,000) × 4 ÷ $900,000 = $1,000,000 ÷ $900,000 = 1.11
For every dollar you spent on sales and marketing in Q1, you generated $1.11 in annualized ARR by Q2. That's healthy.
Interpreting Magic Number benchmarks:
Magic Number reveals problems before they destroy your business. Declining Magic Number over time means your market is saturating (TAM constraints), competition is intensifying (higher CAC), your product-market fit is weakening (lower win rates), or your sales process is breaking down (longer cycles).
Traditional Magic Number measures total S&M efficiency, but smart companies now calculate separate Magic Numbers for new customer acquisition versus expansion revenue. Expansion Magic Numbers typically run 2-3x higher than new customer Magic Numbers because expanding existing customers costs far less than acquiring new ones.
VPs of Marketing should resist pressure to increase spend if Magic Number is below 0.75. You'll just burn more cash proportionally. Optimize what you're doing first through better targeting, improved conversion rates, and faster sales cycles. CMOs should track Magic Number trends over 4-6 quarters. This tells you whether your GTM motion is improving or degrading. Report this to boards instead of vanity metrics like "MQL growth."
The newest critical metric that took over VC diligence in 2023-2024: Burn Multiple, introduced by David Sacks at Craft Ventures.
Burn Multiple = Net Burn ÷ Net New ARR
This answers the most important question for unprofitable companies: How much cash are you burning to generate each dollar of new ARR?
Example:
Burn Multiple = $300,000 × 12 ÷ $900,000 = $3,600,000 ÷ $900,000 = 4.0x
You're burning $4 in cash for every $1 of ARR generated. That's unsustainable unless you're pre-product-market-fit and about to hit an inflection point.
According to Craft Ventures' framework:
Burn Multiple naturally decreases as you scale and gain operating leverage. A seed-stage company at 3.0x might improve to 1.5x by Series B and 0.8x by Series C.
The strategic complement: Rule of 40
This balances growth and profitability for more mature companies:
Rule of 40 = Revenue Growth Rate % + EBITDA Margin %
Target: The sum should equal or exceed 40%.
Examples:
The power of Rule of 40 is the trade-off it allows. Hyper-growth companies can run negative margins if growth compensates. Slower-growth companies must deliver profitability to hit 40%.
According to BCG research, only 9-26% of SaaS companies currently achieve Rule of 40 depending on revenue tier, but those that do command significant valuation premiums over peers.
Founders need to understand that your investors will increasingly evaluate you on Burn Multiple first, revenue growth second. The "grow at all costs" era is dead. VPs of Marketing defending budget increases should show improving Burn Multiple because you're generating more ARR per dollar spent. CMOs presenting to boards for mature companies ($20M+ ARR) should use Rule of 40 as your north star metric. Trade-offs between growth and profitability are fine as long as the sum stays above 40%.
The difference between a correct metric and a misleading one often comes down to tiny details in calculation methodology. Here's how to avoid the expensive mistakes most teams make.
Before calculating anything, you need clean data. Most early-stage companies start with spreadsheets, which works until about $1M ARR. Beyond that, you need actual systems.
Your minimum viable metrics stack:
A billing system that tracks subscription state (Stripe, Chargebee, Recurly). This is your source of truth for revenue. A CRM that tracks deal flow (HubSpot, Salesforce, Pipedrive). This measures sales pipeline and conversion. A product analytics tool (Amplitude, Mixpanel, Heap) tracking user behavior. This predicts churn before it happens. A metrics aggregation platform (GrowthOptix, ChartMogul, Baremetrics, ProfitWell) that pulls everything together.
The critical rule: Single source of truth. Revenue data lives in billing. Customer counts live in billing, not CRM (CRM has "opportunities" that may never convert). Product usage lives in analytics. Never maintain the same metric in multiple places. They'll diverge, and you'll spend weeks in meetings arguing about which number is "right."
Annual contracts: Divide by 12, always. A customer paying $12,000 upfront for annual service creates $1,000 MRR, not $12,000. Yes, you received cash. No, that's not all revenue this month.
Multi-year contracts: Divide by total contract months. A 3-year, $180,000 contract is $5,000 MRR ($180,000 ÷ 36 months), even though you might have invoiced annually.
Upgrades mid-month: If a customer upgrades from $100 to $200 on the 15th of a 30-day month, that month's MRR shows $150 for that customer (prorated). Next month shows $200. Don't retroactively adjust prior months.
Discounts and promotions: If you offer 3 months at 50% off, recognize the actual revenue received, not full price. MRR during discount months is the discounted amount. After discount expires, MRR adjusts to full price.
Failed payments: If a customer's payment fails, they stay in MRR until you've given up on recovery (typically after 30 days of failed attempts). Don't instantly remove them. Many payments fail temporarily and succeed on retry.
Free trials: Produce $0 MRR. Obvious, but people still occasionally count them.
The most common mistake: incomplete cost inclusion. Teams calculate CAC using just ad spend or just sales salaries, not fully-loaded costs. Here's the complete checklist:
Sales costs: Base salaries, commissions, bonuses, payroll taxes and benefits, sales operations team salaries, recruiting and training costs for sales hires, sales tools (CRM, sales engagement, data providers), travel and entertainment.
Marketing costs: Marketing team salaries and benefits, advertising spend (paid search, paid social, display, retargeting), content creation (writers, designers, video production), marketing tools (automation, analytics, SEO tools), agencies and contractors, events and sponsorships, website costs.
Overhead allocation: Typically 20-25% of direct costs to account for office space, management overhead, HR, finance support, and other shared services.
A team that calculates CAC as just ad spend might show $500 CAC. The same team with fully-loaded costs shows $5,000 CAC (10x different). This leads to completely wrong conclusions about unit economics.
The attribution window problem: If your sales cycle is 90 days, attributing customers acquired in March to March's S&M spend undercounts the full investment. You spent money in January and February on leads that closed in March.
Best practice: Use a blended approach. Track same-period CAC for fast iteration (this month's customers ÷ this month's spend), but also calculate 3-month lagged CAC for accuracy (this month's customers ÷ average of this month + prior 2 months' spend). Report both.
The formula seems simple but creates three classic errors:
Error 1: Annual churn isn't monthly churn × 12. If you have 5% monthly churn, annual churn is not 60%. Calculate it as: 1 - (1 - monthly churn rate)^12 = 1 - (0.95)^12 = 1 - 0.5404 = 45.96%. Churn compounds because you're losing 5% of a shrinking base each month.
Error 2: Including new customers in the denominator. Churn measures what happened to your starting customer base. If you started January with 100 customers, acquired 30 new customers in January, and lost 8 customers:
Wrong: 8 ÷ 130 = 6.15% churn Right: 8 ÷ 100 = 8% churn
Adding new customers to the denominator artificially deflates churn and creates a false sense of security.
Error 3: Not separating voluntary and involuntary churn. Involuntary churn (failed credit cards) is an operations problem. Voluntary churn (conscious cancellation) is a product or value problem. These require completely different solutions. Track them separately:
The simple method works for early-stage companies:
LTV = ARPA ÷ Monthly Revenue Churn Rate × Gross Margin %
Example: $200 ARPA, 2% revenue churn, 80% margin: LTV = $200 ÷ 0.02 × 0.80 = $10,000 × 0.80 = $8,000
This assumes customers never expand, which undervalues businesses with strong NRR. The cohort method is more accurate:
The cohort method reveals expansion revenue patterns the simple method misses. If customers grow from $200/month to $350/month over their lifetime, simple LTV of $8,000 becomes cohort LTV of $14,000 (75% higher).
Use simple LTV for early-stage quick estimates. Switch to cohort LTV once you have 12+ months of customer data and clear expansion patterns.
The biggest rookie mistake? Tracking the same metrics at every stage. A pre-revenue startup obsessing over Rule of 40 is wasting time. A $20M ARR company not tracking it won't get funded.
Your entire focus: Does anyone want this enough to pay, and will they stay?
Track only these 5 metrics:
Ignore these metrics completely:
Investors look for evidence of product-market fit, not perfect metrics. They want to see retention improving over time, customers experiencing value fast (Time to Value declining), and early signals of word-of-mouth growth. If your first 20 customers have 0% churn after 6 months and are telling others about you, that matters infinitely more than any calculated CAC or LTV.
Red flags at this stage: Customers churning before 90 days indicates you haven't achieved product-market fit yet. Keep iterating. Time to Value extending beyond 2 weeks suggests your onboarding is too complex or the product requires too much setup. High variance in customer engagement (some customers love it, others barely use it) means you haven't figured out your ICP yet.
You've proven people want this. Now prove you can acquire them profitably at scale.
Add these 7 metrics:
Continue tracking from previous stage: MRR growth, customer count, Time to Value, gross margin.
Still ignore: Rule of 40 (growth matters more than profitability at this stage), Burn Multiple (you're expected to be burning).
Investors look for improving unit economics over time. Your Series A investor wants to see LTV:CAC improving from 2:1 to 3:1+, CAC Payback compressing from 24 months to 18 months to 12 months. They're betting you'll achieve efficient growth by $10M ARR. Magic Number approaching 0.75-1.0 proves your sales and marketing engine is working.
Critical decisions at this stage: If CAC Payback exceeds 18 months or LTV:CAC is below 3:1, fix it before scaling. Companies that scale broken unit economics just accelerate their path to bankruptcy. It's counterintuitive because revenue growth looks good, but you're burning more cash than customers will ever generate.
Segmentation becomes critical. Don't blend SMB and enterprise customers in metrics. A company serving both might have terrible overall NRR (80%) but discover SMB is 60% NRR while enterprise is 130% NRR. That insight redirects the entire strategy toward enterprise.
You've built a growth engine. Now prove it's efficient and durable.
Add these 5 metrics:
Everything from previous stages remains relevant. You now have 12+ core metrics to track.
Investors look for path to profitability. Your Series B/C investor isn't demanding profitability today, but needs to see the trajectory. Rule of 40 approaching 40% proves you can balance growth and profitability. Burn Multiple declining from 2.5x to 1.5x to 1.0x shows improving efficiency.
The expansion revenue inflection: At $10M ARR, expansion revenue should represent 25-30% of net new ARR. By $50M ARR, it should hit 40-50%. If you're not seeing this shift, you have a serious product breadth or expansion motion problem.
Critical decisions: This is where companies often need to shift from founder-led sales to professional sales organization. Metrics reveal the transition point. When founders can't personally close enough deals to hit growth targets, you need scale hiring. Track rep productivity closely: if reps aren't hitting quota, don't hire more reps (that scales the problem). Fix enablement, ICP, or product gaps first.
You're building toward public markets. Metrics must be public-company grade.
Add these 5 metrics:
Everything from all previous stages remains relevant. Your board deck now has 15-20 core metrics.
Investors look for public market readiness. Rule of 40 isn't nice-to-have anymore. It's mandatory. NRR above 120% becomes critical for premium valuation.
Customer concentration presents risk. If your top 5 customers represent >20% of revenue, public investors will haircut your valuation because losing one customer creates existential danger. You need to proactively diversify and show declining concentration over time.
The profitability transition: By $100M ARR, investors expect a clear path to sustained profitability. You might still be investing in growth (negative EBITDA), but the trajectory must show improvement. Companies that reach this scale burning cash as inefficiently as they did at $10M ARR won't get funded anymore. The 2023-2024 market correction made that permanently true.
After analyzing hundreds of board decks and investor presentations, these are the recurring mistakes that sink fundraising conversations and board meetings.
Averaging metrics across completely different customer segments produces garbage insights.
A company reports 85% NRR and panics. Deeper analysis reveals:
These are completely different businesses masquerading as one. The enterprise motion is working brilliantly. The SMB motion is broken. Blended metrics obscure this critical insight.
Segment everything by:
Present metrics by segment, then provide blended roll-ups for overall context. Never only show blended numbers.
Nothing destroys board trust faster than metric definitions changing quarter to quarter.
Q1 you define "active customer" as anyone with an active subscription. Q2 you change it to "customers who logged in during the past 30 days." Your "active customers" count drops 15%, creating panic. Did you lose customers, or did you change definitions?
Document every metric definition in a "metrics dictionary" shared with your board:
When you change definitions (sometimes necessary), explicitly call out the change, show old vs. new calculation side-by-side for one quarter, and explain why you changed it. Never silently change definitions.
Analyzing only customers who remained creates wildly optimistic retention metrics.
You analyze your "best customers" to understand what drives retention. Every single one of them has activated 3+ features. Conclusion: "Feature adoption drives retention!" You build your entire customer success strategy around driving feature adoption.
The problem? You only analyzed survivors. What about the churned customers? They might have tried adopting those features but found them confusing, buggy, or irrelevant, which caused churn. You completely missed the causality.
Always include churned customers in retention analysis. Compare behavior between retained and churned cohorts. The differences reveal what actually predicts retention versus what correlates but doesn't cause it.
Metrics that look impressive but inform zero decisions waste everyone's time.
Vanity metrics commonly seen:
"We have 100,000 registered users!" Investor asks: "How many are active?" Pause. "Um, about 5,000 logged in last month." Suddenly your impressive metric reveals a 95% inactive user problem.
Apply the "so what?" test. If a metric changed by 20% next month, what specific action would you take? If there's no clear action, it's vanity. Replace it with an actionable metric.
Instead of "100,000 registered users," report "5,000 MAU with 35% month-over-month growth" and "Activation rate of 20%, up from 15% last quarter due to improved onboarding."
Teams constantly recalculating historical metrics create distrust and confusion.
Your January board deck shows December MRR at $500,000. Your February deck shows January MRR at $450,000 with December restated as $475,000. Your board thinks: "Did they lose $25K MRR, or did they just miscalculate last month? Can I trust any of these numbers?"
Lock historical periods after closing. Use accrual accounting that captures revenue in the right period. Once you close a month, the numbers don't change (except for material errors that require restatements with explicit explanations).
If you need to adjust methodology going forward, show old and new calculations side-by-side for one period, then move to the new methodology. Transparency builds trust.
Taking credit for customer outcomes you didn't cause inflates metrics artificially.
Marketing reports "80% of revenue is marketing-attributed." Sales says "Wait, we closed those deals through direct relationships." Everyone's counting the same revenue.
The attribution game gets played with:
Define attribution models clearly and apply consistently. Better yet, stop arguing about attribution and focus on incremental value. Run tests where you turn channels off and measure impact on downstream metrics. A paid search channel driving 30% first-touch attribution but only 5% incremental revenue (when you pause campaigns) is worth far less than a 10% first-touch channel that delivers 10% incremental revenue.
The metrics aren't independent variables. They form a system where changing one affects others. Understanding these relationships prevents optimizing one metric while destroying another.
These three metrics form a tightly coupled system:
Reducing churn by 1% (from 5% to 4% monthly) creates a chain reaction:
This is why customer success isn't a cost center. It's a revenue multiplier. Every dollar invested in reducing churn unlocks multiple dollars of sustainable growth spending.
The opposite chain reaction happens with increasing churn. Churn rises from 4% to 5% monthly:
Small changes in retention metrics create exponential effects on growth through the interconnected system.
Expansion revenue isn't just additive. It's multiplicative over time through compounding.
You have 100 customers at $1,000 MRR each ($100K MRR base).
Without expansion (100% NRR):
With 20% annual expansion (120% NRR):
That's just ONE cohort. With new customer acquisition each year, the compounding accelerates dramatically.
With new acquisitions: Add $100K MRR in new customers each year, all expanding at 120% NRR:
This is why companies with strong NRR command significant premiums. The compounding effect on revenue growth is exponential, not linear.
Product-led growth reveals a critical insight: where customers experience value determines everything downstream.
Research analyzing SaaS companies shows activation improvements have significantly more impact on MRR than trial conversion improvements. Why?
The causal chain:
Each link multiplies the effect. A user who never activates contributes zero LTV regardless of acquisition cost. A user who activates but takes 30 days might churn before seeing value. A user who activates in 24 hours integrates your product into daily workflows, making churn far less likely.
Growth marketers should obsess over activation rates before anything else. If activation is below 40%, stop running more acquisition campaigns. You're pouring water into a leaky bucket. Fix activation first through better onboarding, clearer value demonstration, reduced time to first outcome, and removing friction from setup.
Magic Number improvements create a positive feedback loop that accelerates growth.
You start with Magic Number of 0.6, meaning every $1 in S&M spend generates $0.60 in new ARR.
You improve sales process efficiency through better qualification (BANT framework), reduced sales cycle (removing approval bottlenecks), higher win rates (competitive intelligence), and larger deal sizes (value-based pricing).
New Magic Number: 0.9 (50% improvement)
This unlocks the growth loop:
The inverse loop destroys companies. Magic Number deteriorates from 0.9 to 0.6:
Magic Number isn't just a snapshot metric. It's the governor on your growth engine. When it's high, you can pour gasoline on the fire. When it's low, you must fix the engine before adding fuel.
Strip away the noise and you're left with a simple truth: SaaS businesses succeed or fail based on their ability to acquire customers profitably, keep them longer, and expand revenue over time.
Every metric in this guide ladders up to one of those three goals:
If you track nothing else, track those three pillars. Everything else is detail and context.
No credit card required