April 25, 2026
See Which Ads Drive Actual Paying Customers for Your SaaS
(And Which Are Just Burning Your Budget)

Written by
CEO & Co-Founder

April 25, 2026
See Which Ads Drive Actual Paying Customers for Your SaaS — And Which Are Just Burning Your Budget
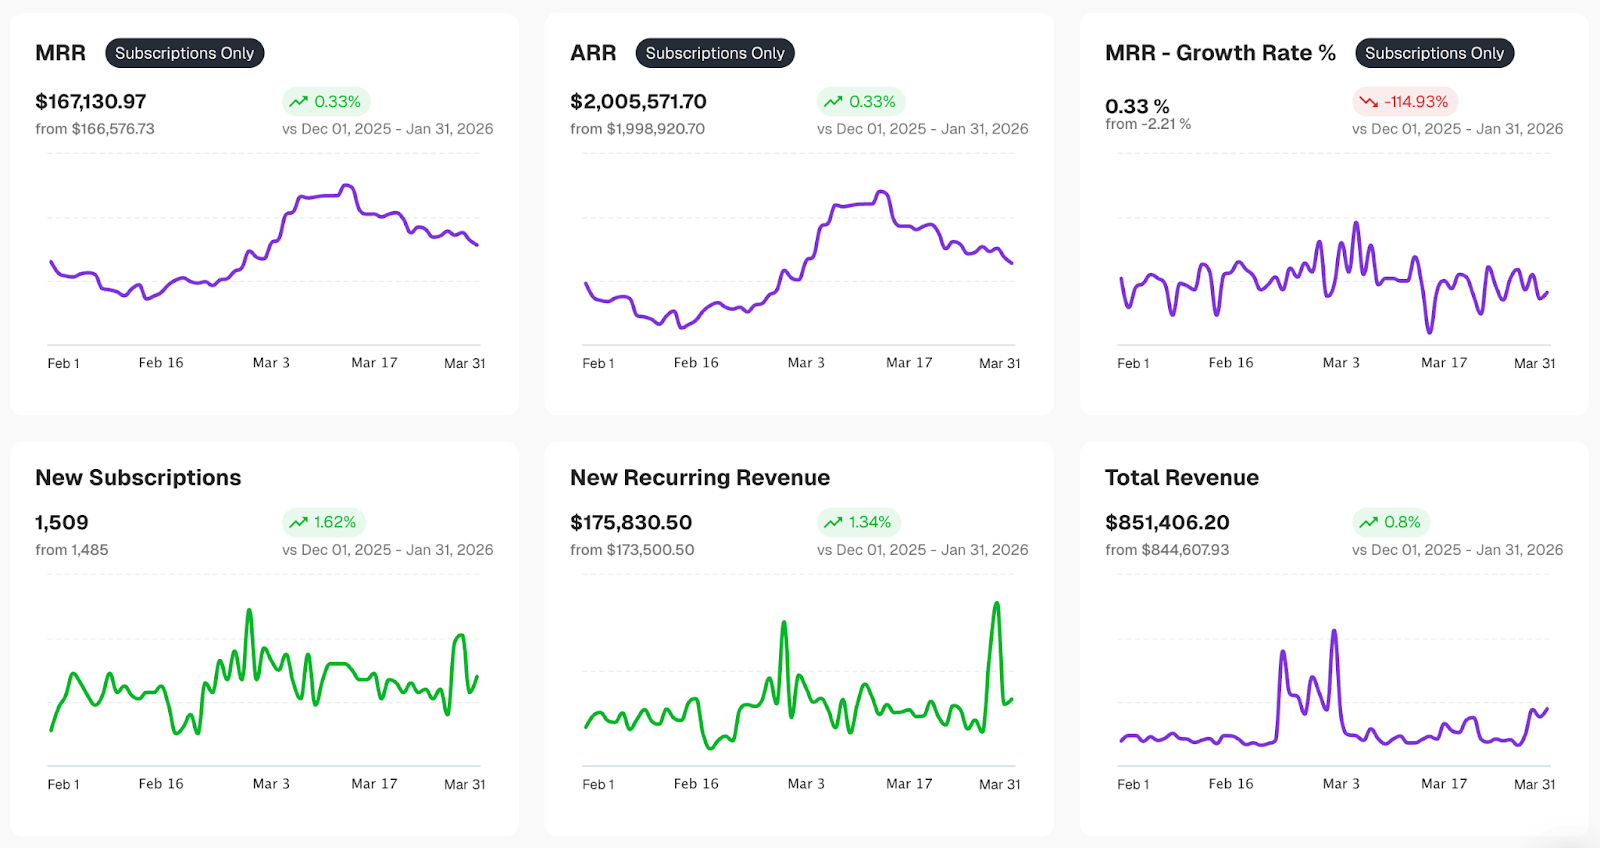
There’s a moment every SaaS founder running paid ads hits. You’re spending $5K, $80K, maybe $420K a month across Google and Meta. The ad dashboards say things are working — clicks are coming in, signups are up, CPA is within range. But when you open Stripe and look at your actual MRR growth… it doesn’t match.
Marketing says the campaigns are performing. Your revenue says otherwise. Customers are signing up but churning out just as fast. Some campaigns seem to produce loyal, high-value subscribers. Others produce signups that vanish in month two. But you can’t tell which is which — because nothing in your stack connects the ad that brought someone in to whether they’re still paying you six months later.
One Indie Hackers founder spent ~$330 on Facebook Ads and thought they had 43 users based on Meta’s reporting. Turns out they only had about 10. Meta was counting “lead events” when people started a flow, even if they never finished signup. The dashboards showed success. The revenue told a different story. (Indie Hackers)
The question isn’t which ads drive signups — your platforms can mostly tell you that.
The question is: which ads and content drive paying customers who stick around and grow your MRR? And which ones are quietly burning your budget on revenue that doesn’t last?
If you can’t answer that, you’re not alone.
Almost no SaaS founder at this stage can — not because they’re not analytical, but because their tools literally can’t show them. This article shows you why, gives you the framework to think about it differently, and explains what changes when you can finally see the full picture.
Every SaaS company has two sets of numbers.
The marketing numbers — CPA, cost per conversion, open rates, click rates, ROAS. And The founder numbers — MRR, churn, LTV, payback period. One set lives in your ad platforms and your email tools. The other lives in Stripe or PayPal.
Whether you’re running ads yourself at midnight or you have a team or an agency doing it for you, the incentive is the same.
Every ad platform, every campaign report, every email dashboard pushes toward one thing: more activity for less money.
Lowest CPA on your ads. Highest open rates on your newsletters. Best click-through on your lead magnets. That’s what gets optimized. That’s what gets reported. That’s what gets celebrated.
But none of those metrics tells you the thing a founder actually needs to know: did any of this produce revenue that sticks?
“Most marketing departments aren’t sophisticated analytics-driven operations — it’s really just ‘number go up = throw more money at it.’” — Hacker News commenter on ad attribution
A campaign that drives $40 trial signups looks like a win, but if those signups churn in month two, they’re inflating your MRR temporarily and then dragging it back down.
A newsletter with a 45% open rate looks healthy, but if none of those readers ever become paying customers, it’s a content expense with no measurable return.
A lead magnet that generates 500 downloads looks like a pipeline win, but if those leads never convert, you’ve spent time and ad budget filling a list that doesn’t produce revenue.
The founder, looking at Stripe, sees the churn, the flat MRR, and the payback period that doesn’t improve. The marketer — or the founder wearing the marketer hat — looking at the campaign dashboards sees success everywhere. Both are looking at accurate data. They’re just looking at different halves of the picture.
56% of B2B marketers say they struggle to connect marketing efforts to ROI. Not because they’re bad at marketing, but because the measurement layer between ads, content, and revenue is fundamentally broken. (Averi / Content Marketing Institute, 2025)
Your ad platform has no idea what happens after the click. Your email tool has no idea which readers become customers. Stripe has no idea where any of them came from. And the one question that connects it all — which campaigns and content produce customers that stick, pay back their acquisition cost quickly, and grow your MRR? — can’t be answered by any of these tools alone.
Most SaaS founders making budget decisions are working from one of two metrics — and both are incomplete.

Cost per conversion is the most common — whatever your campaign counts as a “conversion.” For some campaigns, that’s a trial signup. For others, it’s a content download, a webinar registration, a newsletter signup, or a demo request.
Campaign A gets conversions at $40. Campaign B gets them at $80. So you scale A and cut B.
⚠️ The problem: none of these “conversions” are customers.
A campaign that adds 200 people to your newsletter, where 2 eventually become customers, is not the same as one that adds 50, where 10 eventually buy and contribute to your MRR — even though the latter has a much higher conversion cost. But in your ad dashboard, the ad that drove a conversion at $40 looks like the clear winner — because the dashboard stops counting at the conversion event and never checks what happens after.
Uploadcare documented wasting $50K on Google Ads before learning what actually moved the needle — a post that resonated widely across Hacker News and Indie Hackers. The problem wasn’t that the ads didn’t generate activity. The problem was that nobody could tell which activity turned into revenue. (Indie Hackers)
Blended CAC is what the more analytical founders calculate.
Total sales and marketing spend divided by total new customers. That’s better. But blended CAC averages everything together: your trial signup campaigns, your content campaigns, your retargeting, Google, Meta, organic, referrals — all mashed into one number. A $200 Google customer and a $1,200 LinkedIn customer become the same $400 acquisition.
The spread between a company’s best and worst channel CAC can be as high as 13x — referrals at $150 alongside outbound at nearly $2,000 per customer. Blended CAC averages them all together and hides the gap. (Glen Coyne, B2B SaaS channel analysis)
The metric that actually tells you where to put your next dollar is your CAC:LTV per campaign. Not blended across your whole business. Per campaign. Per ad. Across every type of campaign you run — whether it’s driving trial signups, content downloads, newsletter subscribers, or demo requests.
This works whether the campaign drove a direct trial signup or drove a blog visit that led to a newsletter subscription that led to a trial three months later. What matters is the end result: did this campaign — directly or through the content funnel — produce a paying customer? How long did that customer stay? How much did they spend over their lifetime? That’s your LTV — your customer lifetime value.
Meta campaign (drives traffic to a blog post → newsletter): $12 per newsletter subscriber. Looks cheap. But only 2% of those subscribers eventually become paying customers. Actual CAC: $600. And it takes 4 months to see it.
Google Search campaign (drives trial signups): $40 per signup. But only 5% of those signups ever pay. Actual CAC: $800. Average customer lifespan: 8 months. LTV:CAC: 6:1.
LinkedIn campaign (drives a lead magnet download): $80 per download. Looks expensive. But 8% of those leads eventually trial and pay. Actual CAC: $1,000. However — those customers churn at half the rate of the others. So their LTV is significantly higher, making LinkedIn your best return on ad spend despite the highest sticker price.
One SaaS founder discovered that customers from Product Hunt had 2x better LTV than customers from Google Ads — but both channels showed similar CPA. Without tracking to revenue over time, they would never have known. (CalmOps, SaaS Metrics for Indie Hackers)
In your ad dashboard, the Meta campaign looks like the obvious winner at $12 per conversion.
The LinkedIn campaign looks 6x more expensive. But measured by paying customers — and especially by paying customers who stay — the ranking shifts entirely. And you’d never see it without connecting every campaign type to Stripe revenue.
Ad platforms routinely overclaim — industry analysis shows reported conversions exceed actual sales by 200–300% when you add up what each platform claims. And the further a campaign is from a direct trial signup, the harder it is to trace the path from that first click to a Stripe payment.
There are three gaps between your marketing and your revenue — and they stack on top of each other.
Most SaaS companies at this stage are running two funnels. The direct funnel — ad → trial → paid — your ad platforms can at least partially track. But the content funnel — blog post → newsletter → months of engagement → eventually trial → eventually paid — is almost entirely invisible.
👀 Nothing connects a Meta ad that drove a blog visit in January to a Stripe payment in July.
85% of B2B marketers use content for lead generation because it produces 3x more leads than outbound at 62% lower cost. The leads are there. The measurement isn’t. (Thunderbit, 2025)
Which specific piece of content moved a reader from passive subscriber to trial signup? Was it the case study in month three? The product comparison in month six? Imagine knowing that one newsletter issue had a 4x higher reader-to-trial rate than anything else you sent that quarter. You’d build your whole content strategy around that insight. Instead, it got the same open-rate report as everything else and disappeared into the archive.
One B2B SaaS firm discovered through a pixel audit that it had been attributing over 60% of its leads to paid search — when the actual source was a mix of organic content and email nurture. The content was doing the work. The ads were getting the credit. (DiGGrowth)
Your ad platform counts a $49/month customer who churns in month two the same as a $299/month customer who stays for three years. Both are “conversions.” But one generated $98 in revenue and the other $10,764.
Trial-acquired customers churn at 2–3% monthly, while demo-qualified customers maintain just 3.5% annual churn — at $10K ACV across 100 customers, that’s a $190K revenue difference. Same dashboard number. Wildly different business outcome. (GrowLeads)
A SaaS company invested $30,000 into Google Ads over three months and acquired 42 new subscribers. By CPA metrics, the campaign looked like a success. But with high monthly churn, after 12 months, only 1 of those 42 subscribers remained — producing just $13,423 in revenue. ROI: negative 55%. (Farsiight)
For SaaS with 14-day trials, most conversions do happen within the platform’s 30-day window. But it’s still real for customers who convert after the trial ends (nearly 50% of eventual conversions, according to Totango), freemium users who upgrade months later, and anyone under Meta’s default 7-day click window. These customers show up in Stripe as “organic.” They’re not.
These three gaps stack. Your content funnel is invisible. Customer quality by campaign is invisible. And a portion of conversions happen after the platform stopped watching. Together, they mean the one question that matters — which campaigns and content produce customers who stick and grow your MRR — can’t be answered anywhere in your stack.
Even before you have tooling to connect everything to Stripe, you can start applying this lens across your ads and content:
Take each campaign’s total spend and divide by the number of paying customers you can attribute to it. For trial campaigns, that means tracking past the signup to the payment. For content campaigns (blog, newsletter, lead magnets), that means estimating how many of those leads eventually became paying customers — even if it took months.
This is where the real money hides. Look at your churn data by cohort. Can you spot patterns in which customers stay longest and which leave fast?
A campaign with a $600 CAC and 2% monthly churn is a better investment than one with a $200 CAC and 8% churn — but you’d never know without checking.
Payback period = CAC ÷ monthly ARPA from that customer.
If your average customer from Google pays $150/month and your Google CAC is $800, payback is 5.3 months.
If your average customer from your newsletter pays $200/month (higher plan, higher intent) and your content CAC is $600, payback is 3 months. The “expensive” content funnel pays back faster. This is the number that tells you whether to invest more — not cost per conversion.
If you’re running a newsletter, ask: do I know which emails or blog posts my paying customers engaged with before they signed up? Tag your content by topic or campaign. Check back 60–90 days later and see which content’s readers converted at higher rates.
Even rough signals here are more valuable than the open-rate reports you’re currently looking at.
Whichever campaign you’d currently scale first — ask yourself: do I actually know it produces paying customers who stay and pay back their acquisition cost quickly? Or do I just know it produces cheap conversions? If you can’t answer confidently, you’re optimizing for the wrong metric.
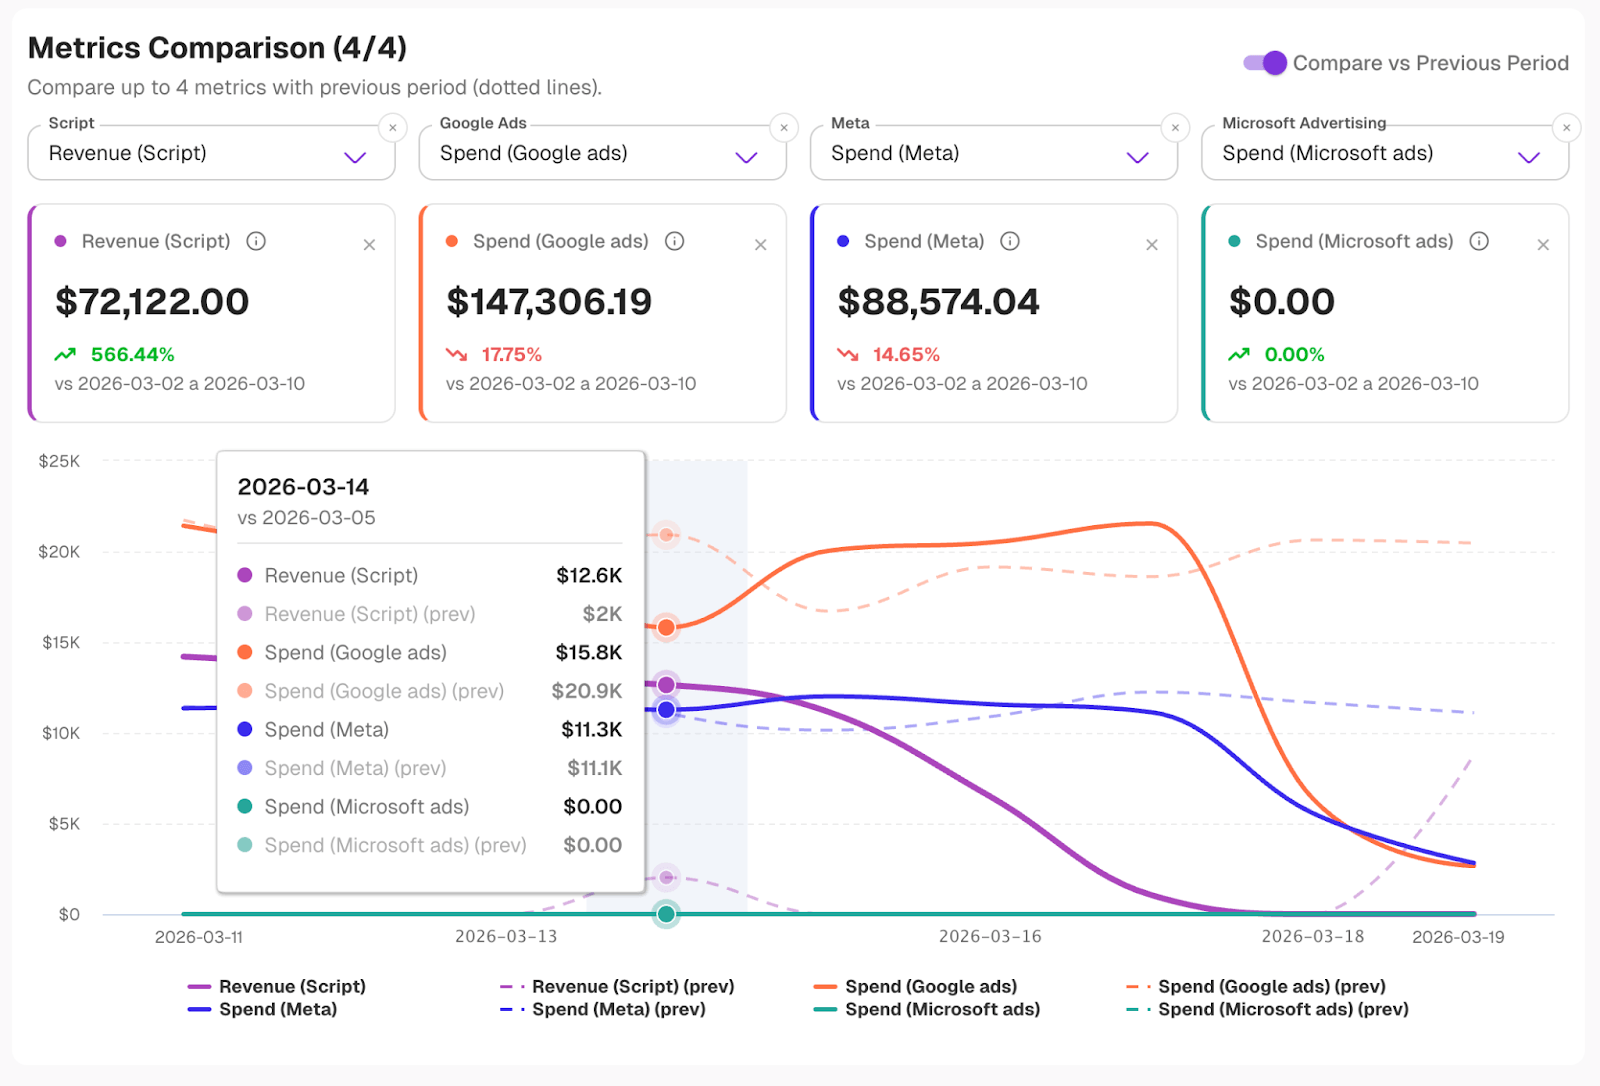
The framework above gets you directional answers. To get exact numbers — campaign-level CAC, retention by campaign, LTV by channel, content-to-revenue attribution — updated automatically and connected to real Stripe revenue, you need a system that traces the full journey. From the ad click or blog visit, through the content funnel or trial, all the way to the Stripe payment. Whether that takes 14 days or 12 months. And then keeps watching.
It connects your ad platforms and your content touchpoints to Stripe and PayPal, and using its proprietary AI platform (FAI), it maps every paying customer back to the journey that brought them in — the campaign, the specific ad, the content they engaged with along the way.

You see CAC by campaign, by ad creative, and by channel. LTV: CAC ratios that tell you not just which campaigns produce customers, but which campaigns produce customers who stick around and grow your MRR. You see which content converts readers into buyers — not just which content gets clicks.

No spreadsheets. No manual matching. No blended averages hiding the truth. No disconnect between your marketing metrics and your founder metrics.
GrowthOptix provides AI driven accurate cookieless tracking with multiple attribution models for the growth metrics that matter.
Join hundreds of SaaS companies who finally understand which marketing drives profitable growth.


