Market Attribution
Complete Customer Marketing Intelligence
Track the complete customer journey from first click to final dollar. Surface campaigns that create customers who stay, pay and grow — not just sign up.
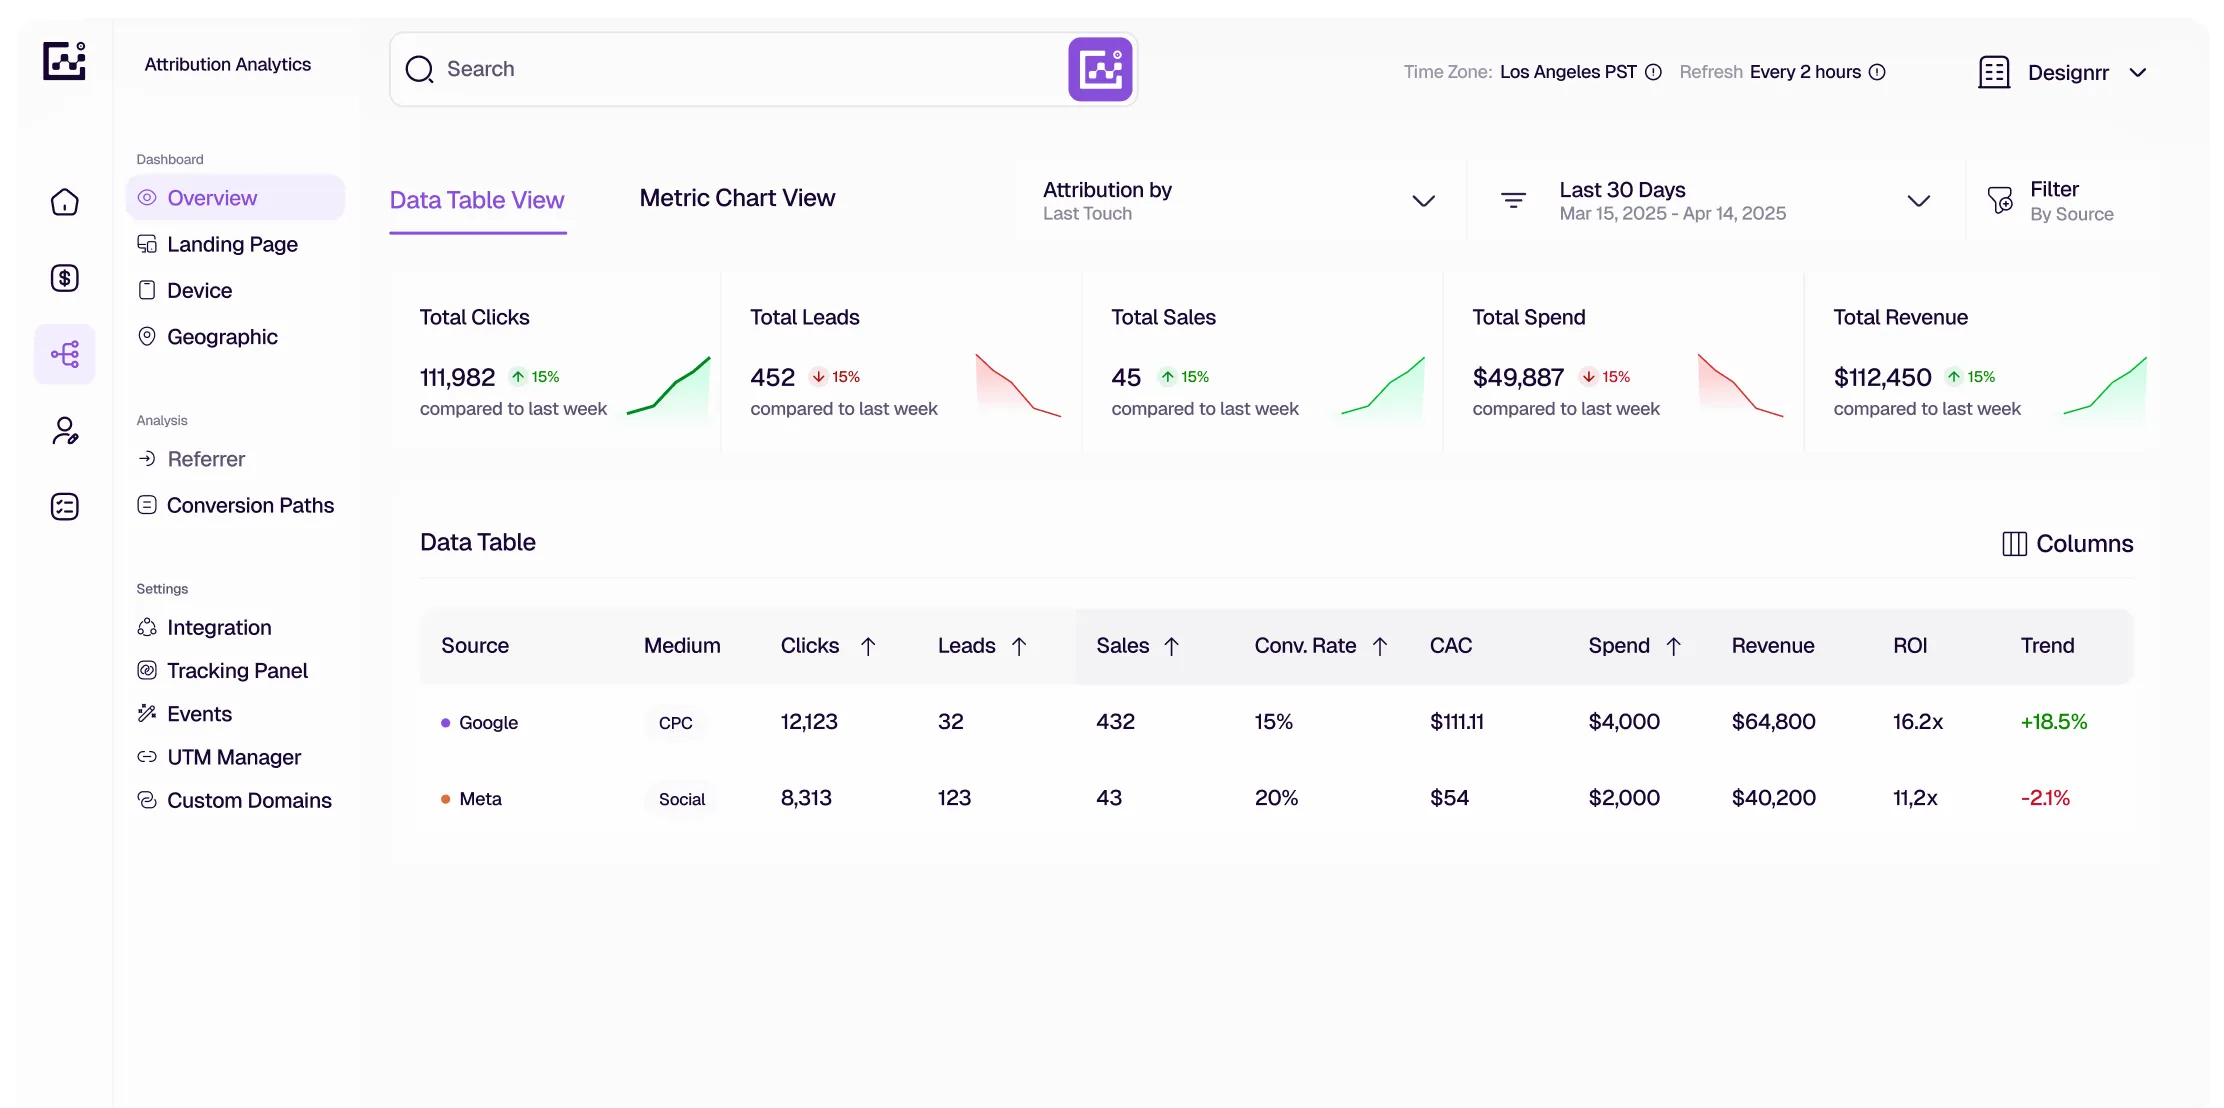

Get The Full Picture Of Your Marketing Performance
Your current attribution platform tells you which campaigns drive signups.
But which drive revenue?
Conflicting Attribution Data
Ad Platforms Report Their Version of Truth
Every ad platform wants to claim the conversion, leaving you with conflicting attribution data. Google says one thing, Meta says another and your actual revenue tells a different story entirely.


Optimizing for the Wrong Metrics
You Optimize for Trials, But 70% Churn Within 3 Months
Your campaigns bring 1,000 new signups but MRR barely moves. Volume isn't value. You need to know which campaigns bring paying customers who actually stick around.
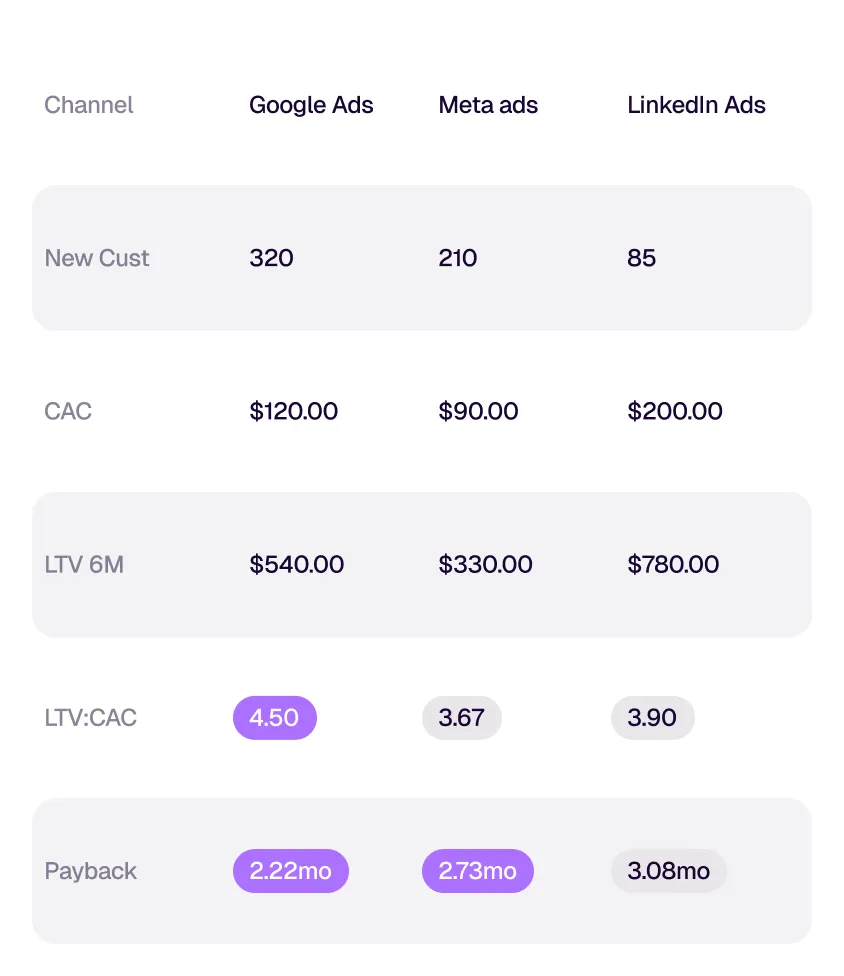
No Real Conversion Visibility
You Know CAC, But Not Payback Periods by Channel
Without clarity into which campaigns have a 2-month vs. 12-month payback period, you’re flying blind on efficiency. Your “low CAC” channel might actually be losing money.
Capabilities
All Your GTM Data in One Place
Three layers of intelligence that competitors can't match.
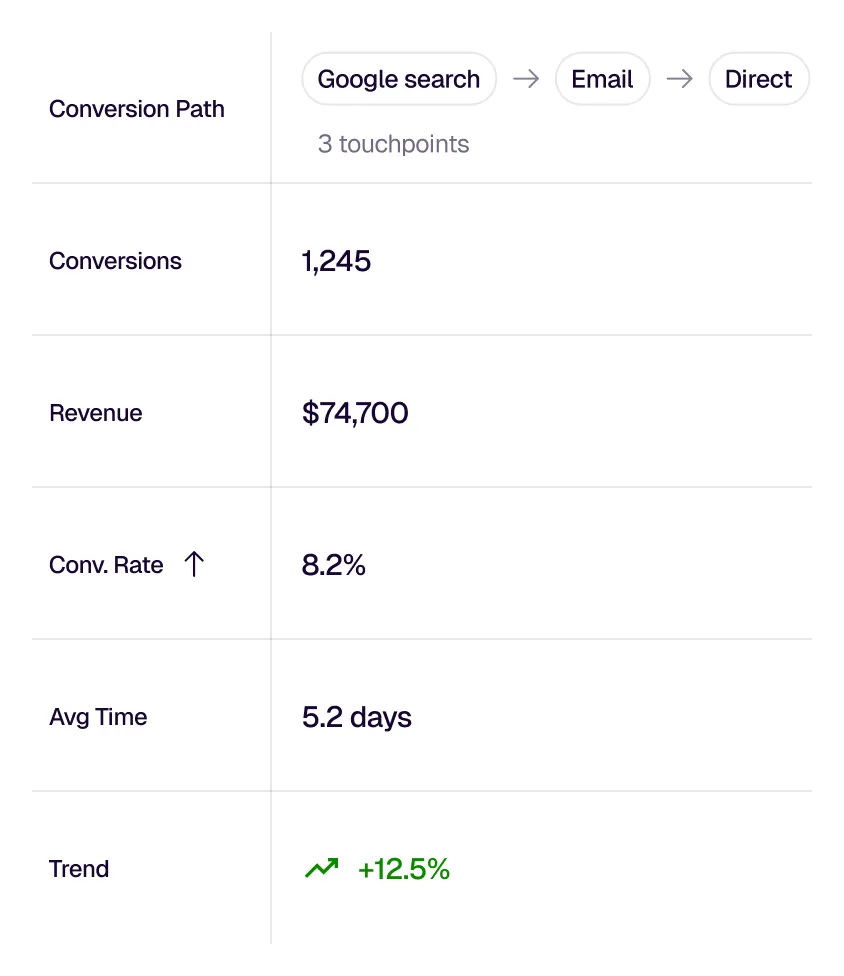
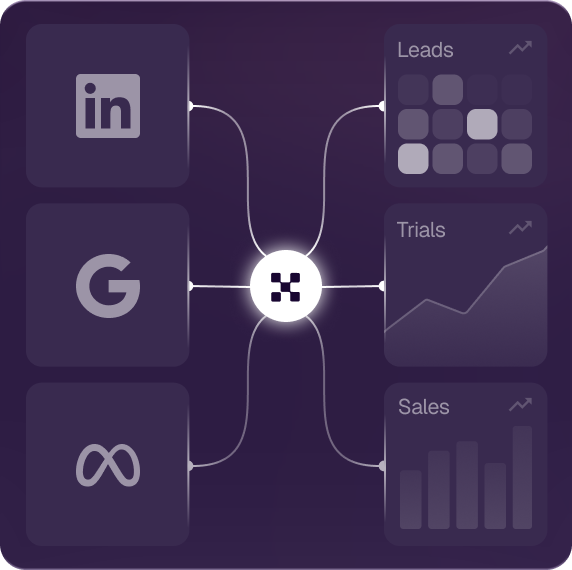
Track the Full Journey
From first touch through trial, activation, conversion, expansion, and renewal. Track every touchpoint from anonymous visitor to loyal advocate. Get visibility competitors simply struggle to provide.
Marketing Metrics That Matter
Stop reporting on leads. Start reporting on business outcomes. See MRR, LTV, and expansion revenue by acquisition channel - and learn which campaigns drive customers who upgrade versus those who churn. Focus on growth, not volume.
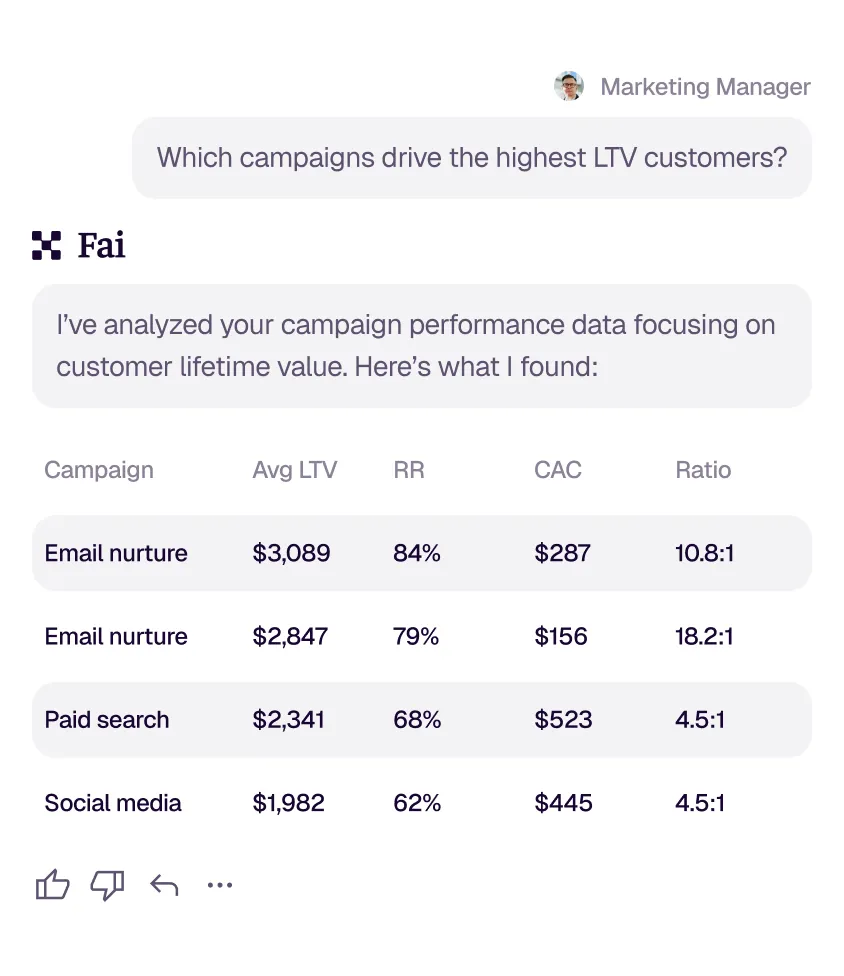
Revenue Intelligence
FAI analyses patterns across your product, marketing and revenue data to surface insights humans would miss. Ask "Which campaigns drive the highest LTV customers?" and get answers backed by real cohort and revenue analysis. Intelligence built for SaaS, not generic AI.
Features
Stop Guessing. Start Growing.
See the business impact of every marketing dollar.
Accurate Tracking
Smart tracking & AI powered cross device tracking enables you to overcome ad blockers and cookie restrictions while staying fully GDPR and CCPA compliant.
Reduce Ad Spend - Boost Conversions
Send rich, revenue based conversion signals back to ad platforms. Let the algorithms optimize for customers who stay and grow - not just those who sign up.
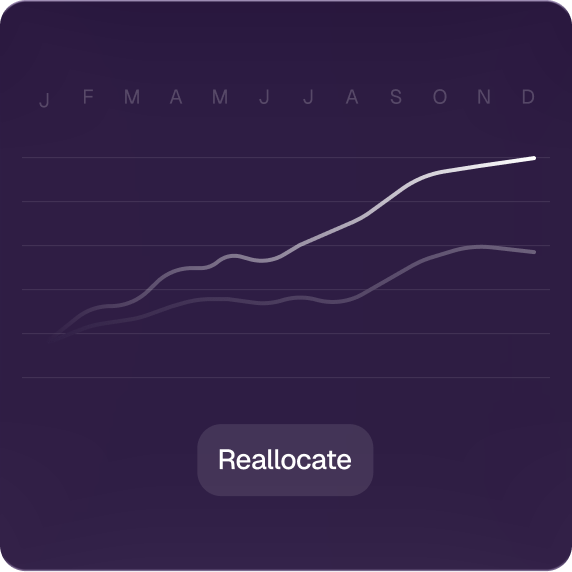
Save on Average 15% on CAC
Reveal true unit economics by channel. Some "low-CAC" channels take 12-months to payback, while "expensive" ones pay back in 3. Reallocate budget based on actual payback periods, not surface-level conversion costs.
Customer testimonials
See what marketing leaders say about our attribution platform.
One of the features I mostly use is the ability to quickly identify recurring versus one-time customers. This helps me focus on converting one-time buyers into long-term subscribers, which has had a direct impact on growing Top Floor marketing's revenue. I've been using GrowthOptix every day, and it's a total game changer. It gives me real visibility into the metrics that matters, revenue growth, churn, subscription, conversion, and even forward looking projections. I can clearly see if the company's churn rate is improving, if more users are converting to subscriptions, what will my total revenue look like nine months from now if I stay at this track. f you're running an online business and using both Stripe and PayPal, there's nothing else like GrowthOptix.


My time at Analytics Corp has been incredibly rewarding. The projects are challenging, and the team is filled with talented individuals who are always willing to help. I have gained a wealth of knowledge and experience that I will carry with me throughout my career.

Integrations
Integrate with your tech stack
Product integrates with everything you need.


Other products
Frame the product around pain points and outcomes.
Analytics
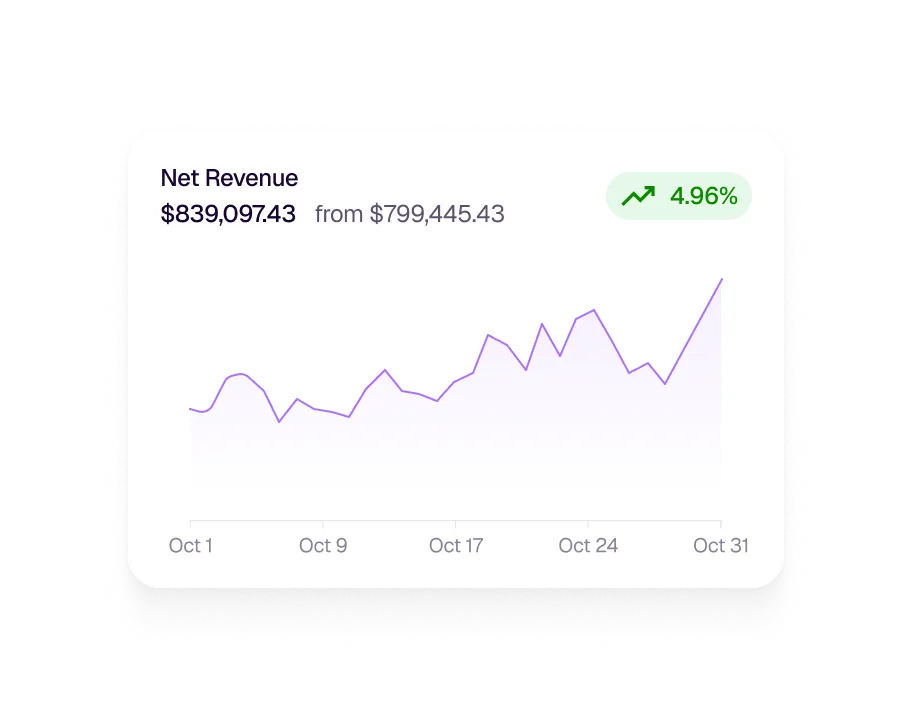
Revenue Analytics
Real-time subscription intelligence across all payment providers. Track MRR, ARR, Churn, LTV plus 60+ other metrics. Forecasting, cohort analysis and expansion tracking in one unified dashboard.
Fai agent
FAI - AI Intelligence
Proprietary AI analyses patterns across your product, marketing and revenue data. Ask anything, get answers to drive profitable decisions.

FAQs
Everything you need to know about GrowthOptix’s Marketing Attribution
Google Analytics tells you who signed up. We tell you who became a paying customer, who expanded, who churned and which channels actually drove LTV and fast payback. Full customer lifecycle, not just sign up.
Yes. We use authenticated user tracking, following the same customer across devices without relying on cookies. 100% accurate, even with iOS 14+, ad blockers and privacy restrictions.
We support first-touch, last-touch, linear, time-decay and custom attribution models. Most SaaS companies start with last-touch to understand what closes deals, then layer in first-touch to see what creates awareness. You can switch between models instantly to get different perspectives.
Most customers are up and running in under 30 minutes. Connect your ad platforms and payment processors with one-click integrations. Our concierge will work with you as much (or little) as needed to get you up and running on day one.
Absolutely. This is what makes us different. We don't stop at sign-up or conversion. We show you which campaigns bring customers who actually succeed with your product and generate recurring revenue. We track 60+ post conversion metrics including trial-to-paid conversion, feature adoption, plan upgrades, expansion revenue and churn. Its customisable, you tailor metrics that work for you.
No credit card required
See Which Marketing Drives Customers Who Stay, Pay and Grow
Used by SaaS teams to move beyond clicks and optimise for revenue.